X-trader NEWS
Open your markets potential
Looking back on the performance of mainstream assets in 10 years: From Bitcoin to US Treasury, who is the king of income?

# Asset Performance Comparison: Bitcoin, Ethereum vs. Traditional Assets (2015-2025)
## Return Performance
Bitcoin (BTC) and Ethereum (ETH) delivered outstanding performance between 2015 and 2025. A $10,000 investment grew to approximately $4.02 million and $11.95 million respectively, far outperforming the S&P 500 (around $29,600), gold (around $30,000), and U.S. Treasury bonds (around $12,600).
## Risk Volatility
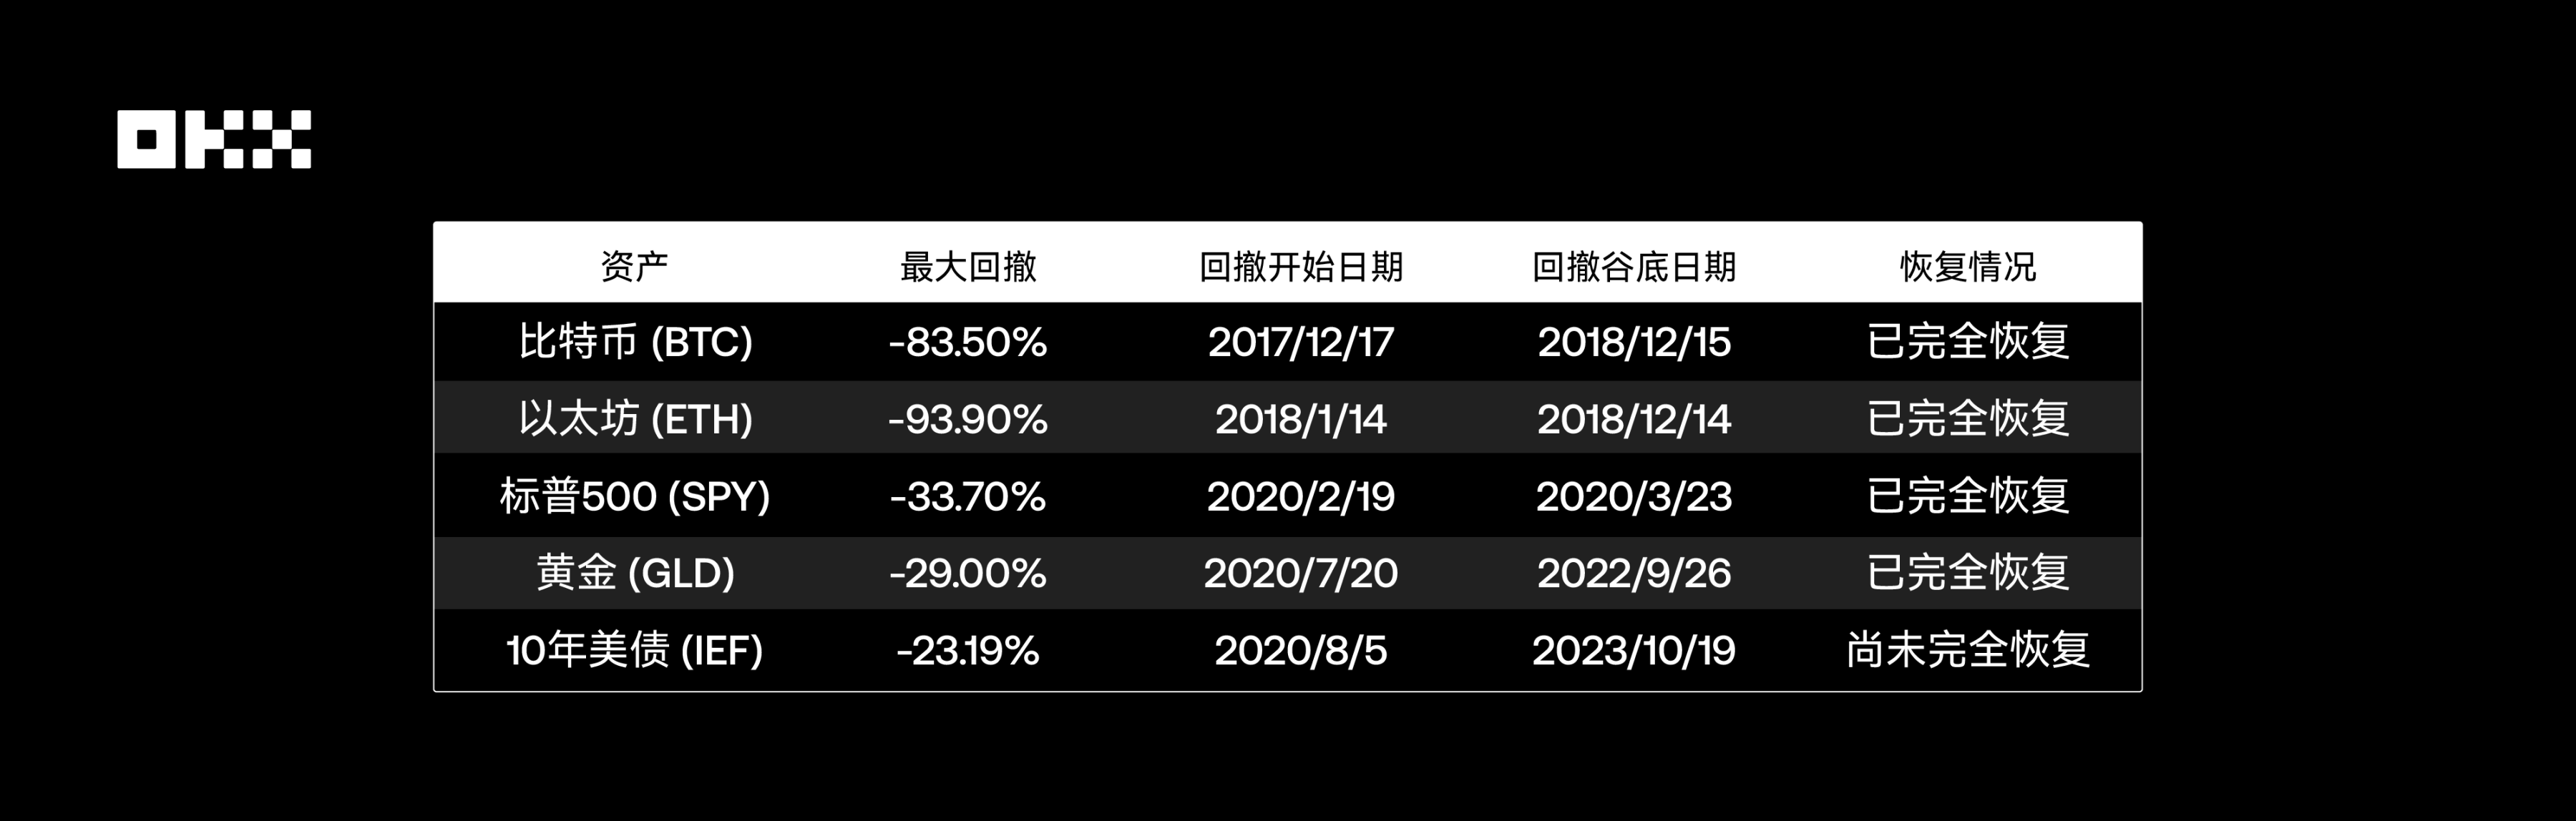
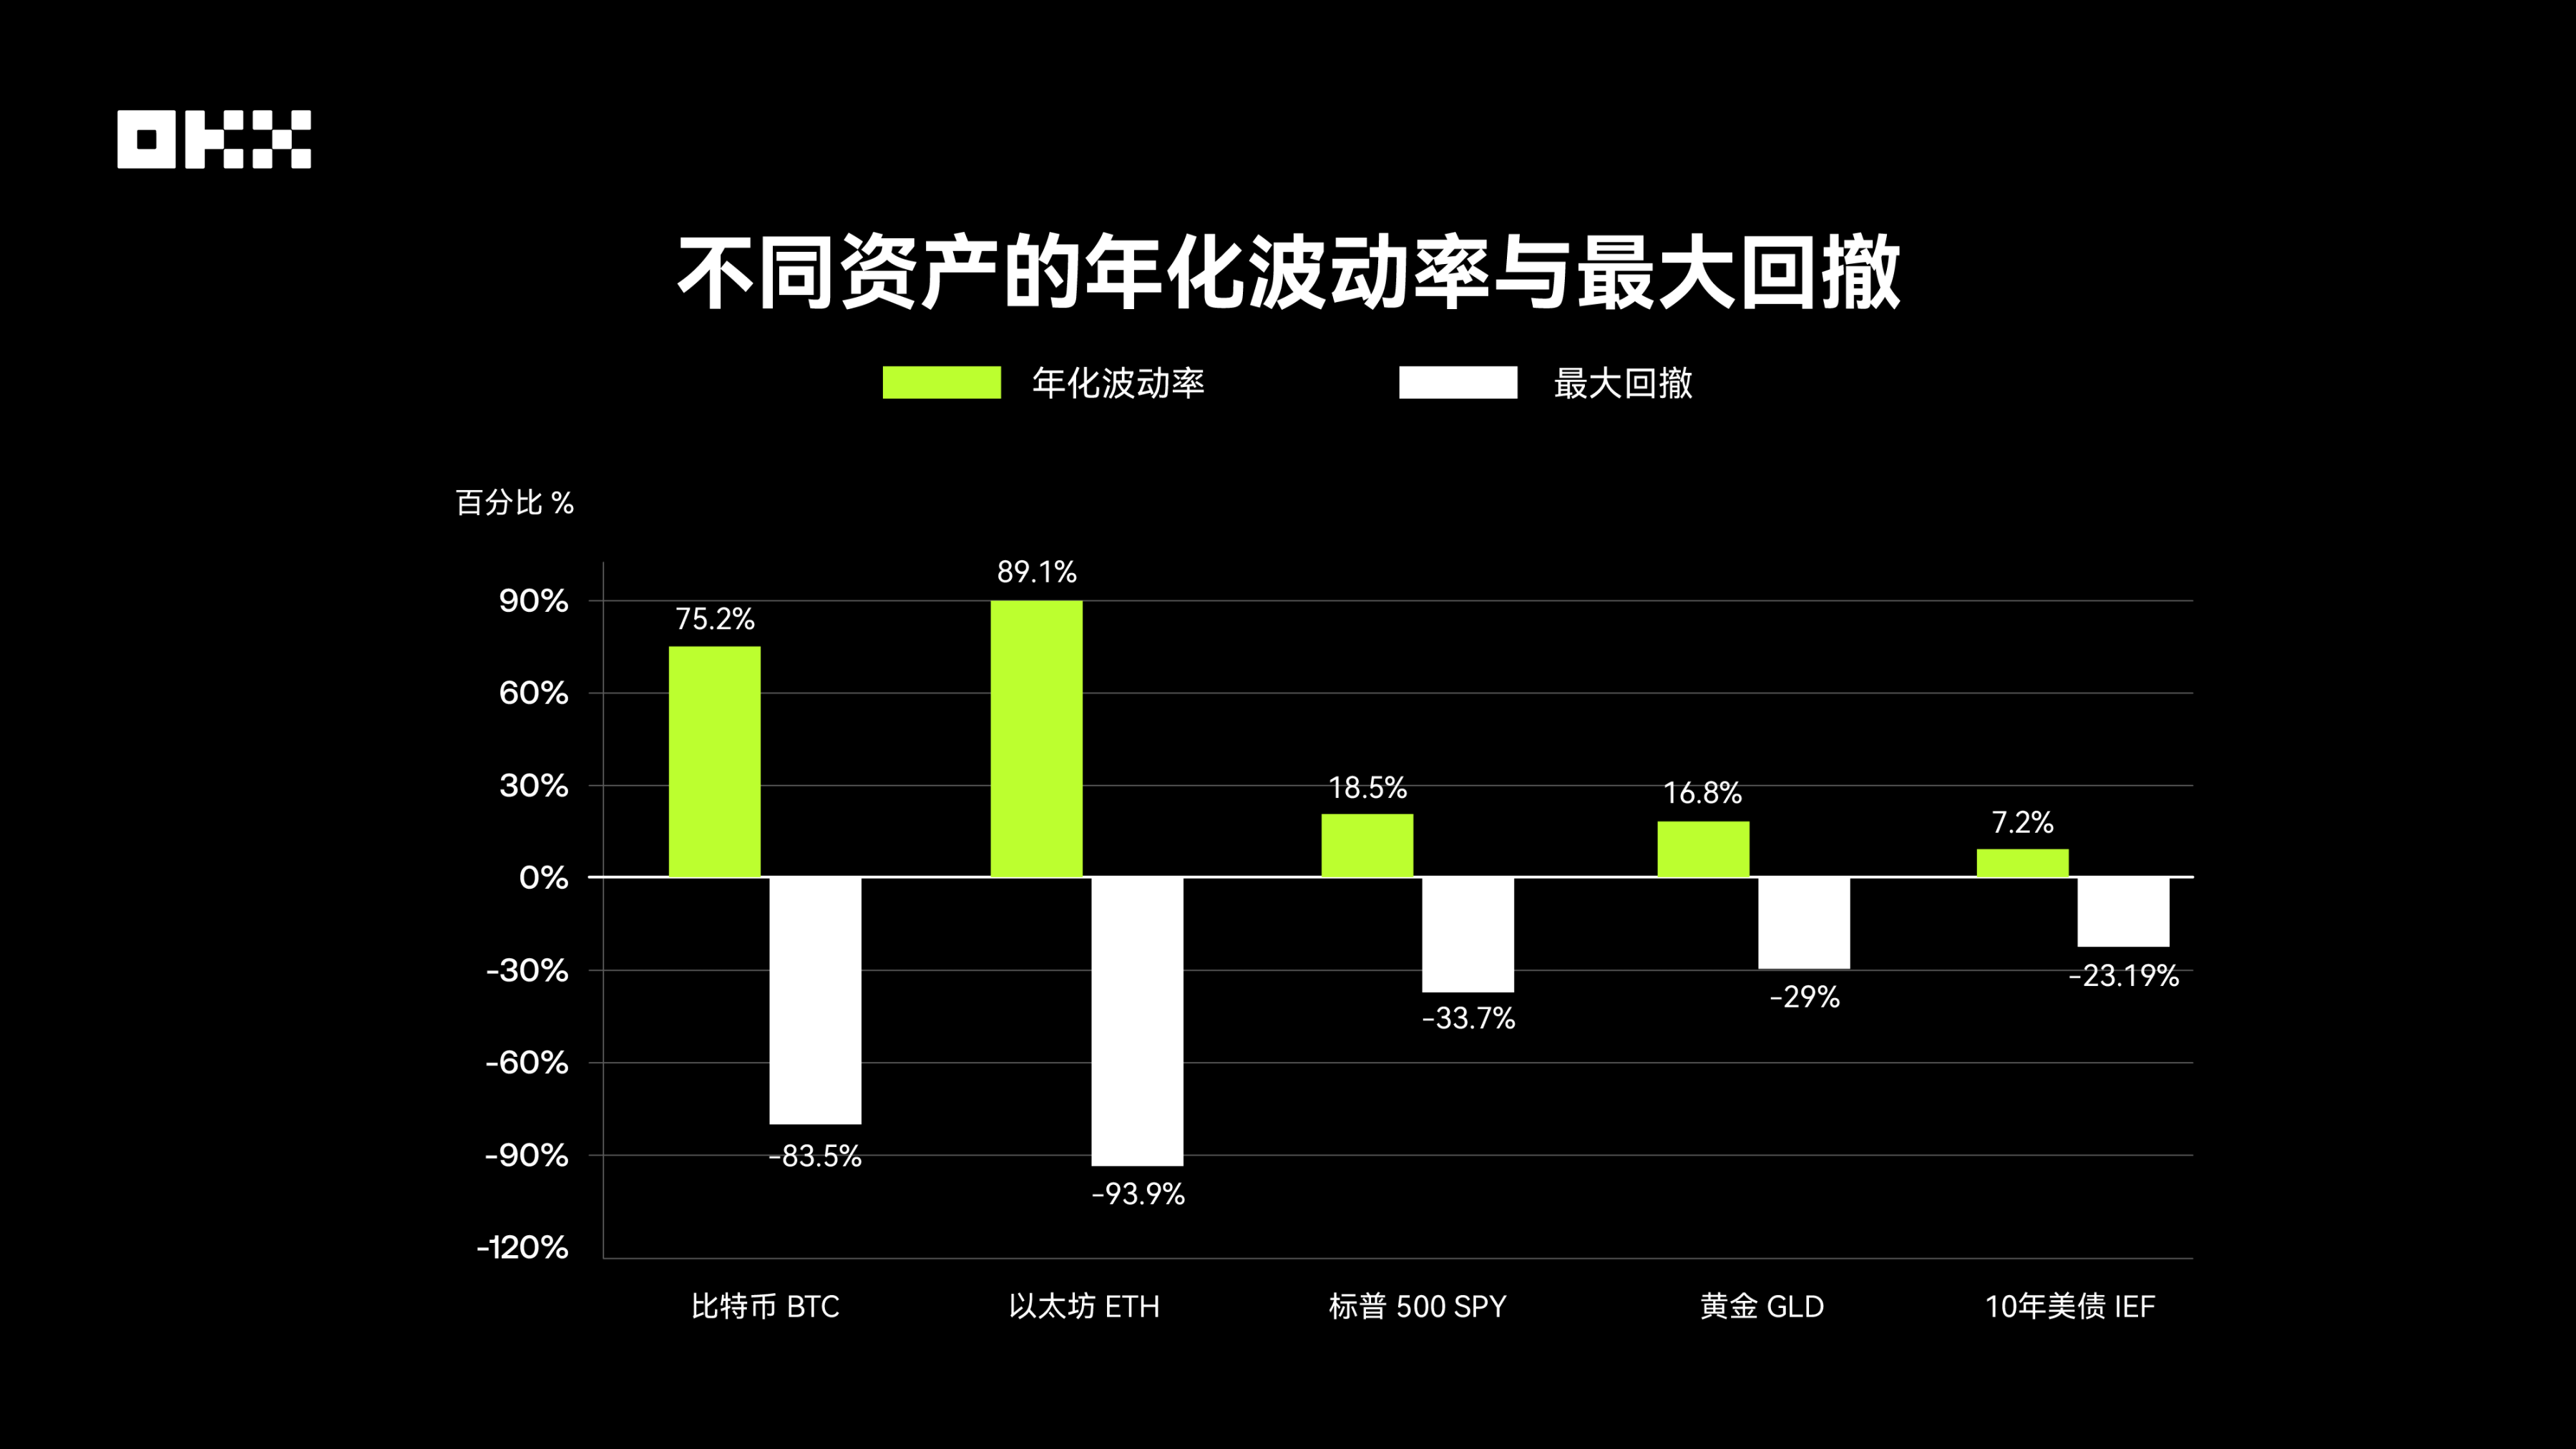
Cryptographic assets exhibit extremely high volatility. Bitcoin and Ethereum experienced maximum drawdowns exceeding 80%, with recovery periods lasting several years. The S&P 500 saw a maximum drawdown of approximately 34%, gold around 29%, and U.S. Treasury bonds about 23%.
## Correlation Changes
The correlation between cryptographic assets and traditional assets has strengthened, particularly showing significant co-movement with the S&P 500 after 2020. However, following the approval of Bitcoin ETFs in 2024, there were signs of partial "decoupling."
## Event Impacts
- During the COVID-19 pandemic, all assets faced indiscriminate selling.
- The 2022 LUNA/FTX collapse only impacted the cryptocurrency market.
- Shifts in Federal Reserve policies directly affected the prices of cryptographic assets.
## Allocation Recommendations
- High-volatility cryptographic assets are suitable for dollar-cost averaging (DCA) to mitigate risk.
- The S&P 500 is appropriate for one-time long-term investments.
- Gold and U.S. Treasury bonds, as defensive assets, help balance portfolio risks.
*Data as of August 31, 2025. It is emphasized that high returns are accompanied by high risks, and diversified allocation should be based on risk preference.*
## Summary
Author: OKX Research Institute
From 2015 to 2025, the global financial market went through a dramatic cycle. Ranging from quantitative easing in the post-financial crisis era, to an unprecedented zero-interest-rate environment, and then to a sharp tightening cycle in response to high inflation, macroeconomic tides continuously impacted various asset classes. Against this backdrop, cryptographic assets represented by BTC and ETH, which far outperformed the S&P 500, gold, and U.S. Treasury bonds in terms of growth, achieved a remarkable leap from being experimental products in the geek community to entering the balance sheets of Wall Street institutions. However, behind these excess returns lie extreme risks—cryptographic assets once suffered deep drawdowns of over 75%, with recovery periods often measured in years, while traditional assets demonstrated greater resilience.
In this regard, the OKX Research Institute focuses on "the performance of five major mainstream assets over 10 years" and attempts to answer a key question: When BTC and ETH are compared with mainstream assets such as gold, the S&P 500 Index, and U.S. Treasury bonds over a 10-year timeframe, what do the true profiles of their returns and risks look like? Have we paid equivalent or even excessive risk costs for the astonishing returns of cryptographic assets? To this end, we will go beyond the comparison of single yield rates and strive to map a comprehensive, objective, and cycle-spanning asset performance profile. (Statistical data as of August 31, 2025)
### Data Source
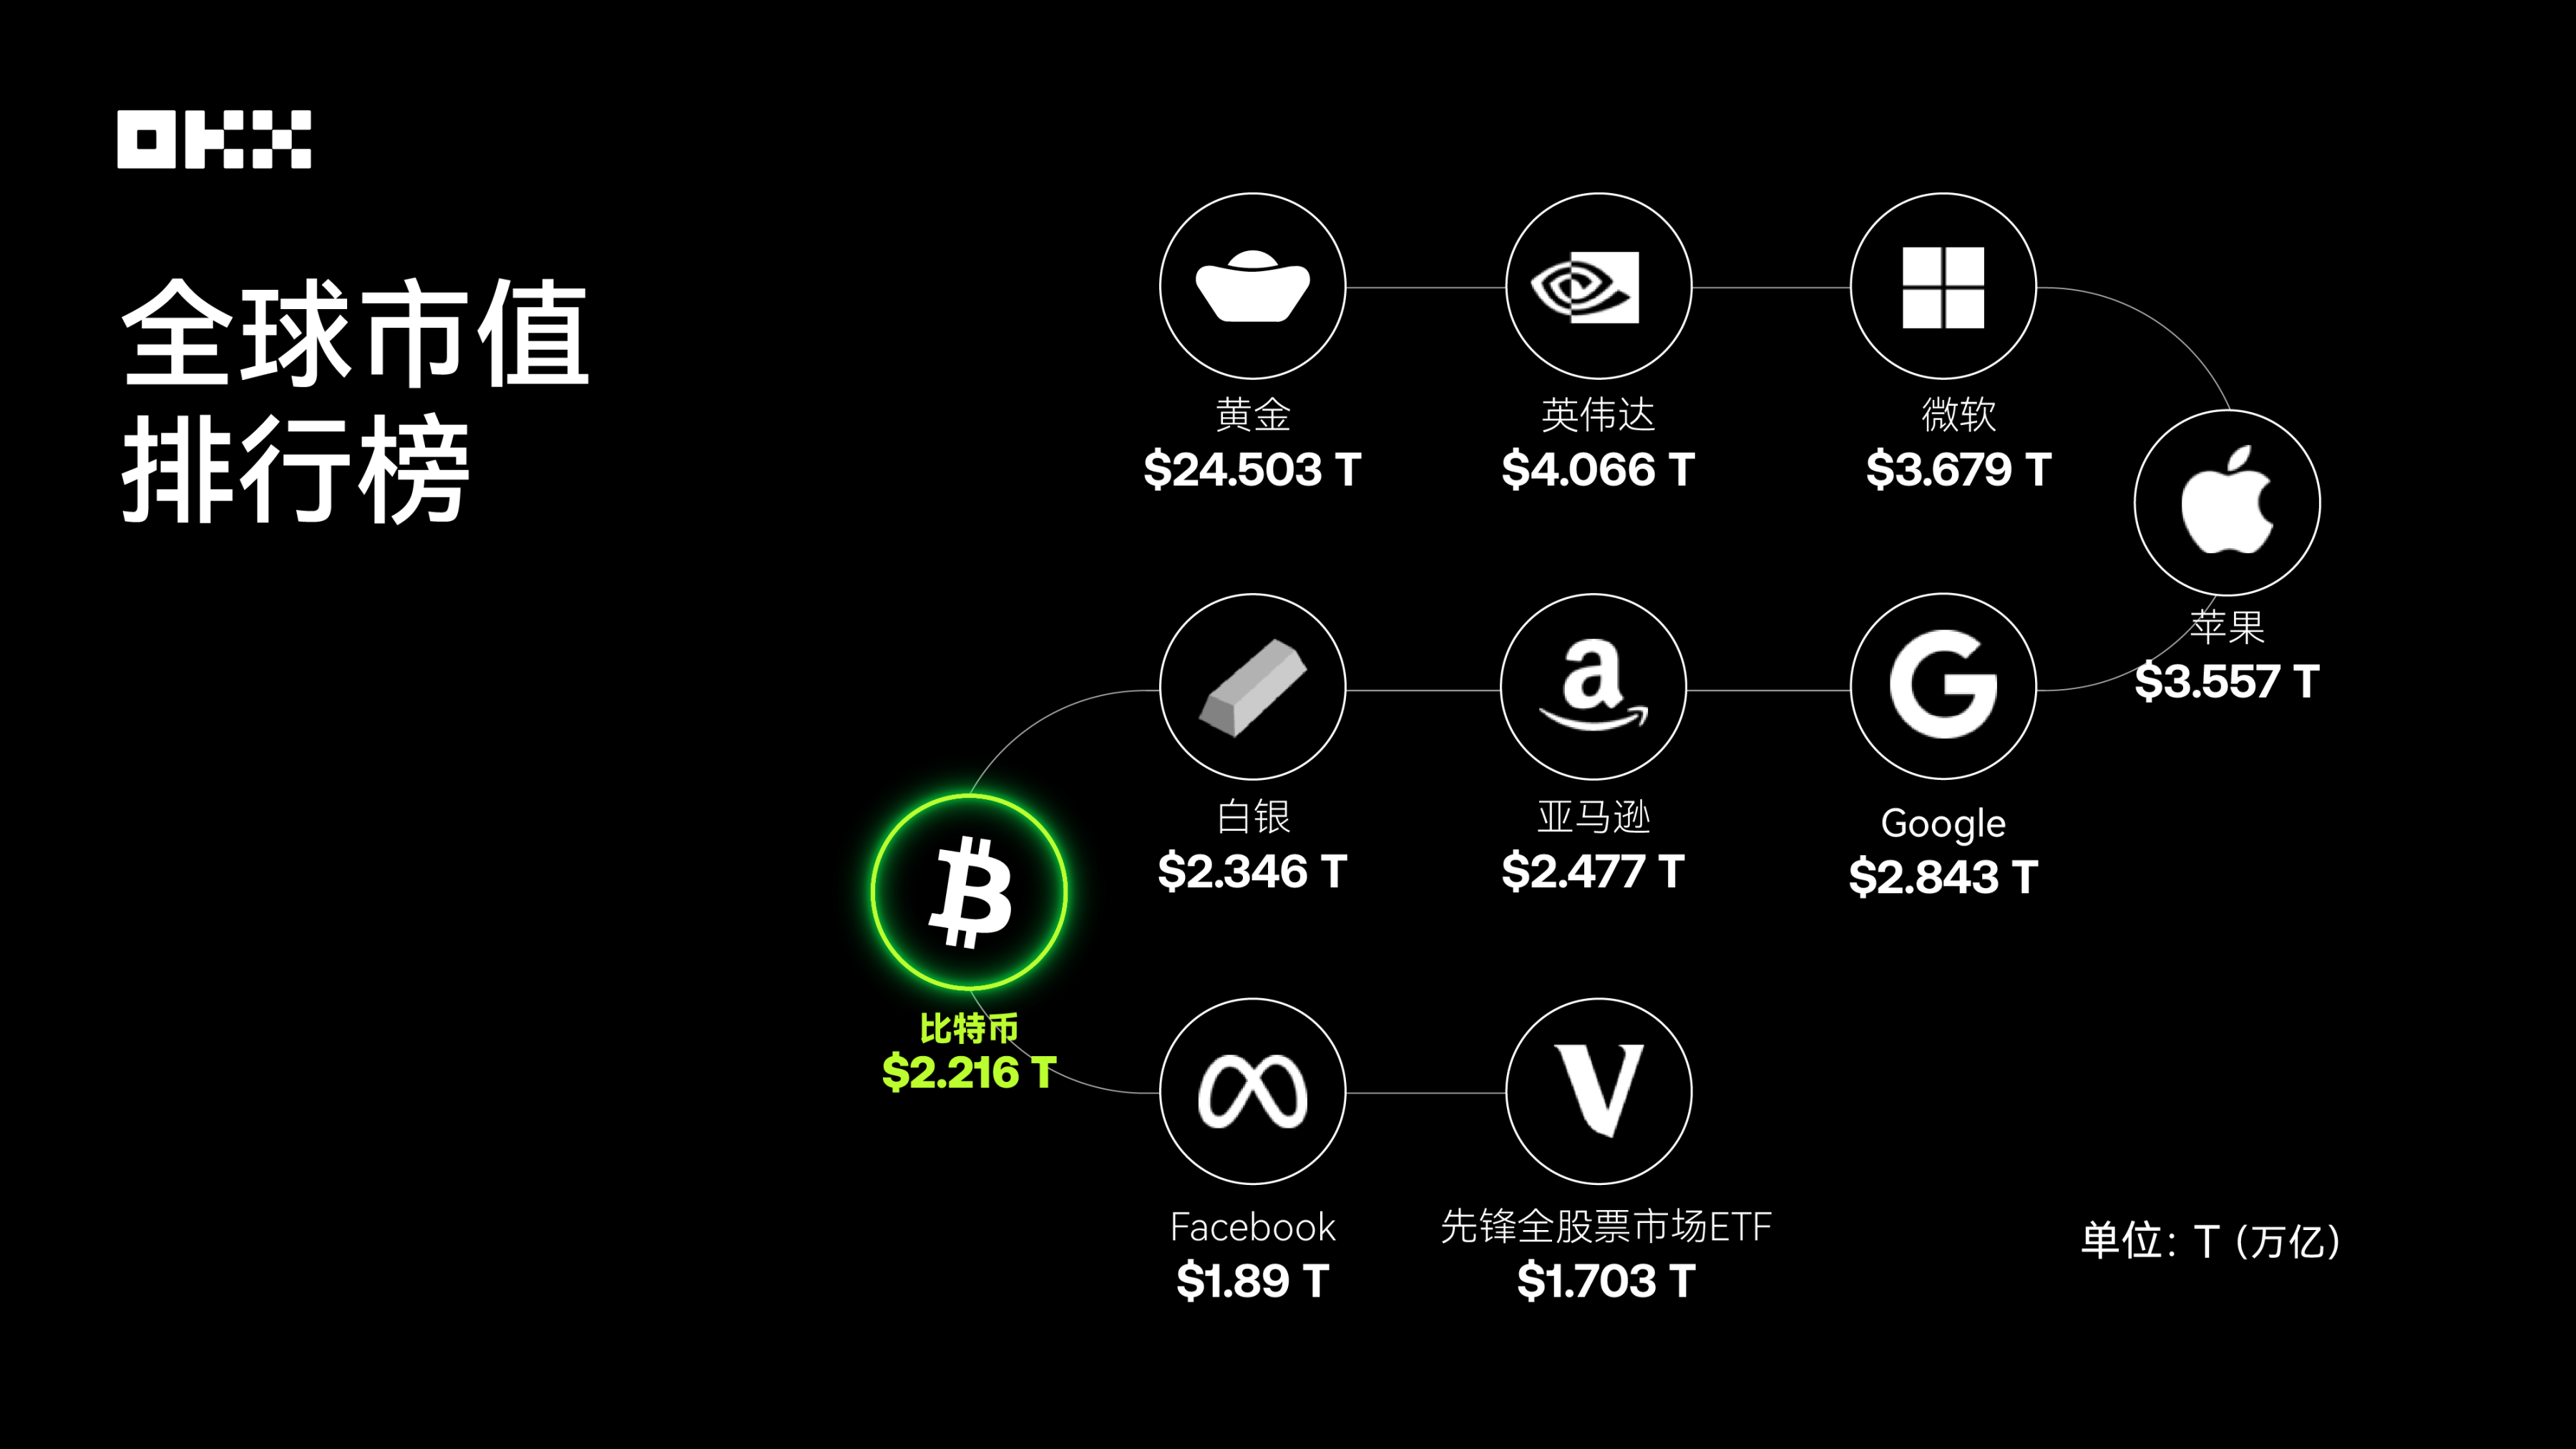
8MarketCap; As of the end of August 2025, Bitcoin has ranked among the top in the global market capitalization of major assets.
## Return Competition: Which Asset Reigns Supreme?
The most intuitive way to evaluate an asset is to observe its long-term value growth trajectory. We assumed investing $10,000 in each of these five assets on August 1, 2015, and tracked the cumulative value changes until August 1, 2025. This comparison clearly reveals the huge differences in wealth creation capabilities across different asset classes.
### (I) Annual Price Snapshot: A Value Benchmark at Key Nodes (August 1 of each year, 2015-2025)
The table below records the closing prices of the five core assets on August 1 (or the first trading day thereafter) each year from 2015 to 2025.
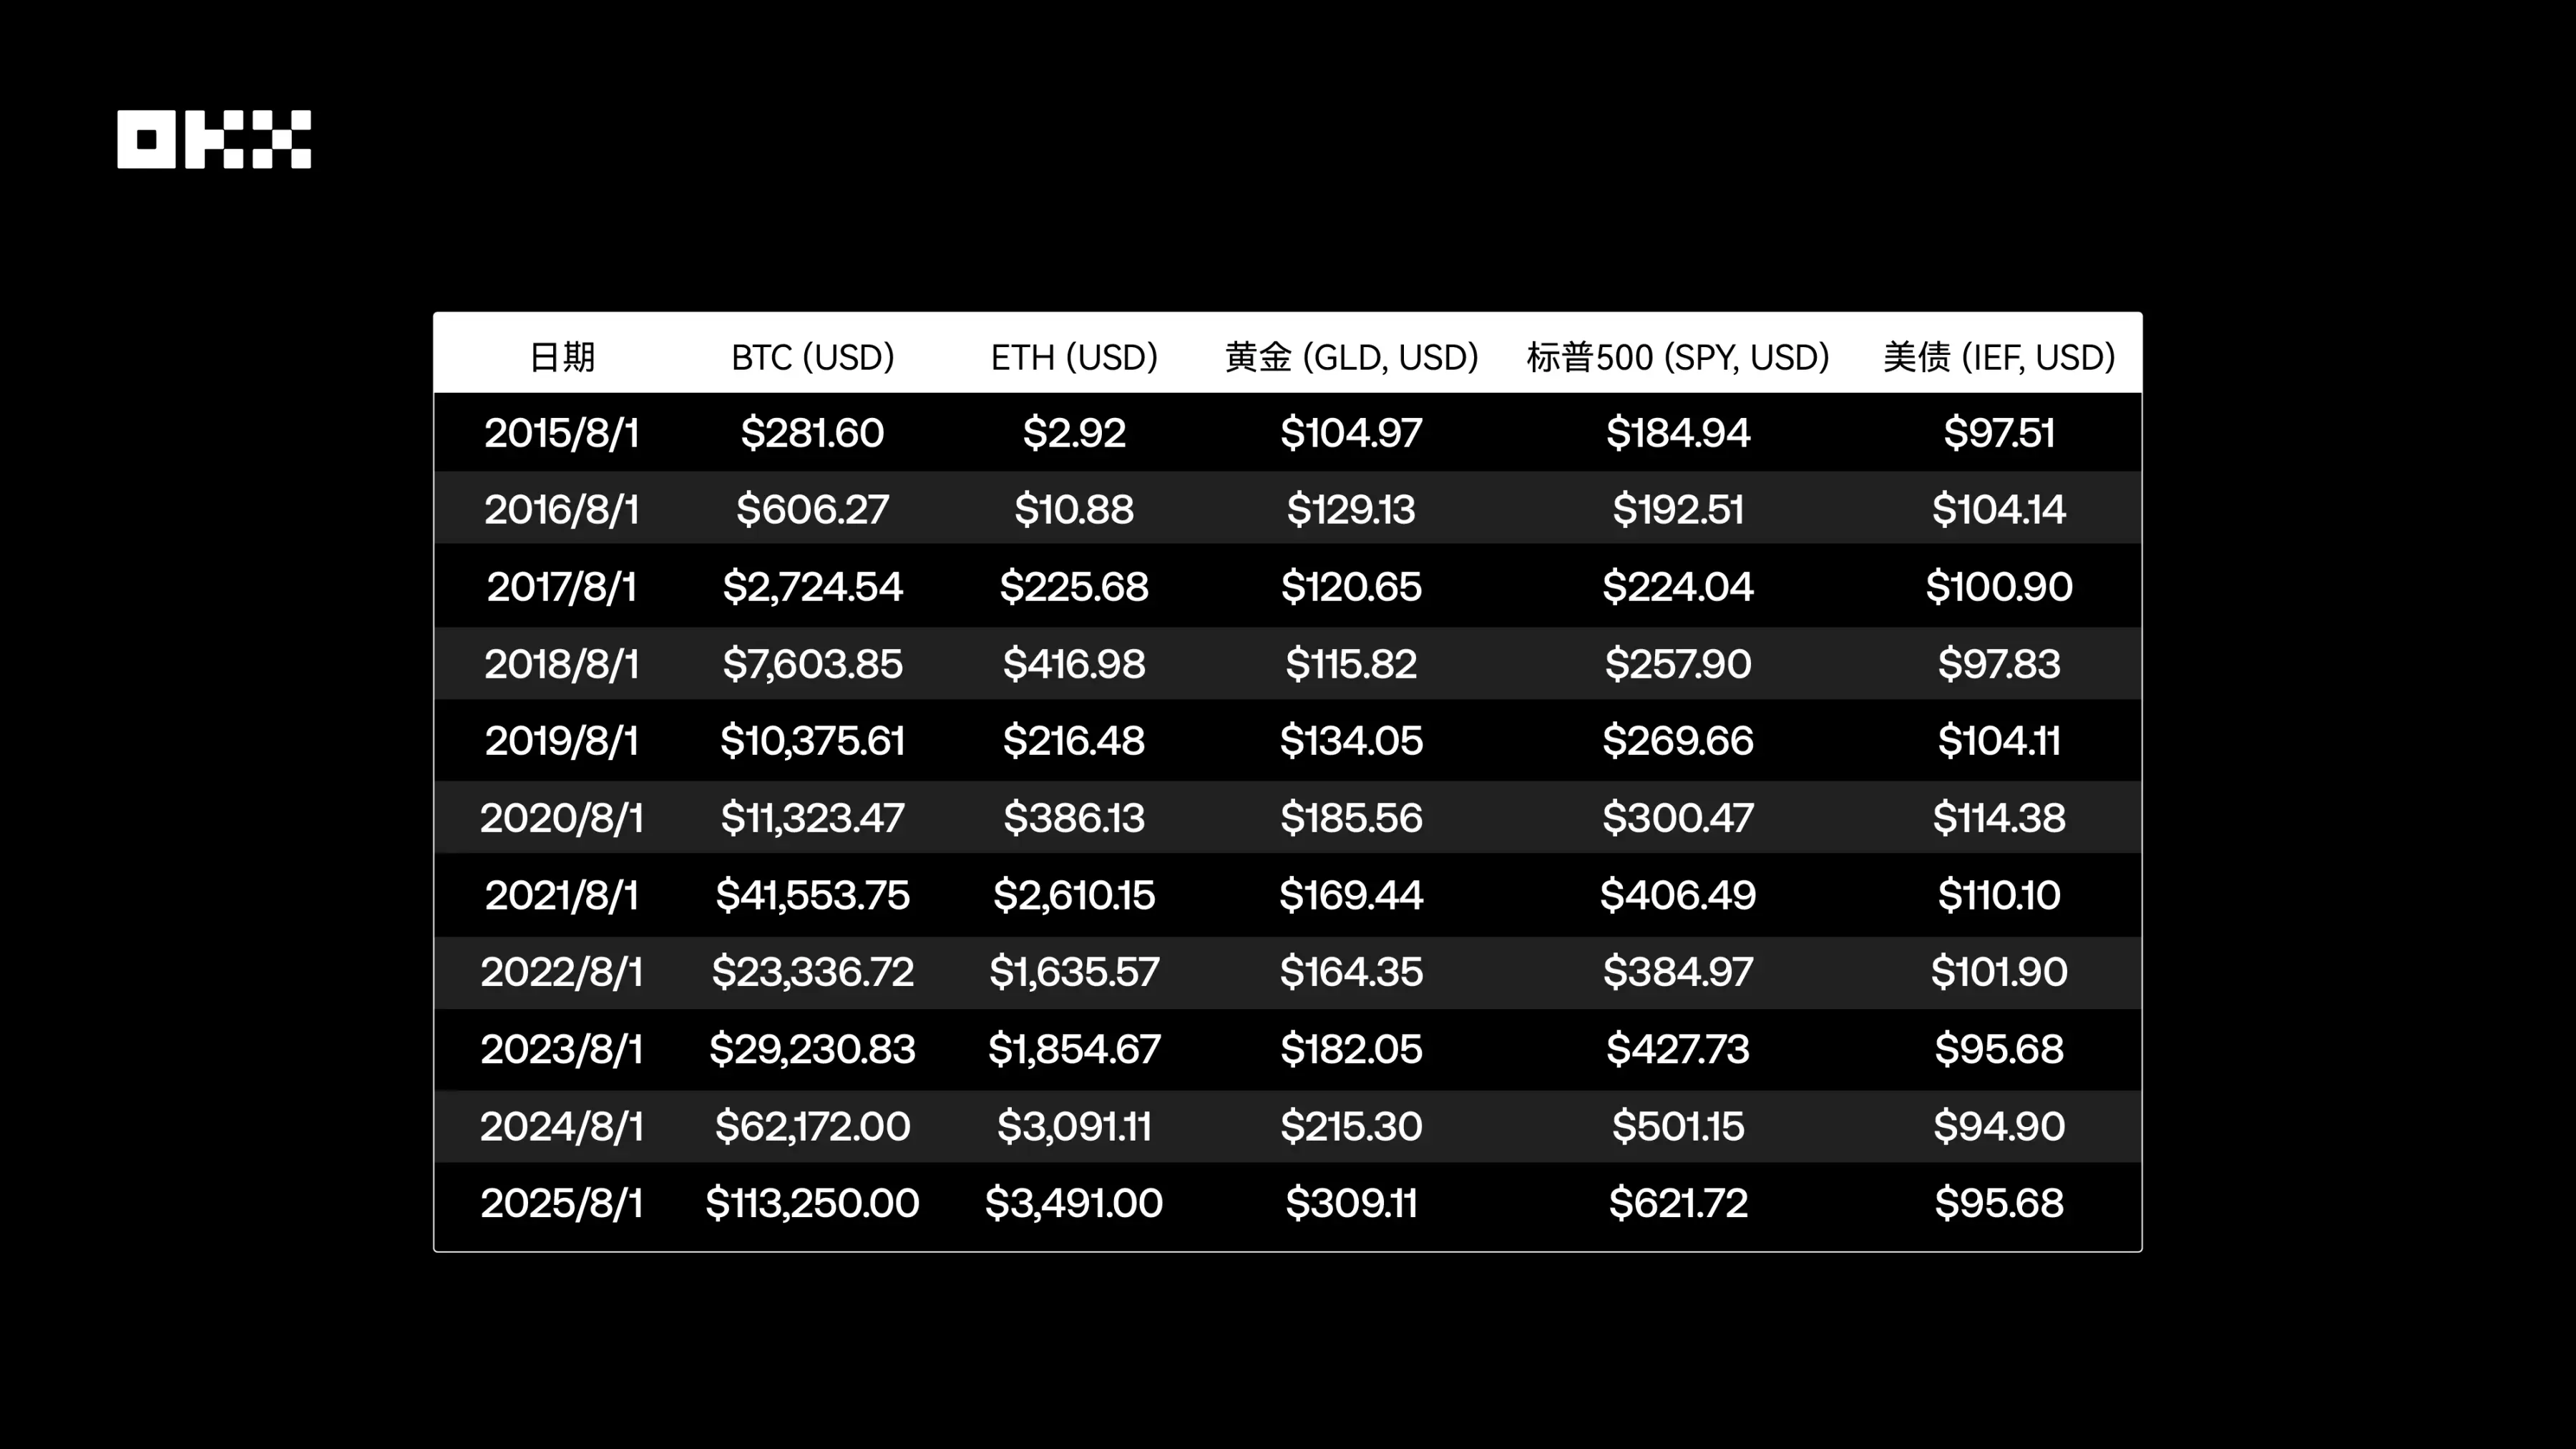
*Data Source: Based on Yahoo Finance and CoinGecko, representing the closing price on the day or the first subsequent trading day. ETF prices are adjusted closing prices.*
From the price snapshots, it is clear that Bitcoin and Ethereum have experienced exponential growth, with fundamental changes in their price magnitudes over the decade. In contrast, the S&P 500 has shown a steady bullish upward trajectory, gold has exhibited fluctuations related to macroeconomic cycles, and the prices of U.S. Treasury bonds have clearly reflected changes in the interest rate environment, coming under significant pressure during the 2022-2023 rate-hiking cycle.
### (II) Annual Peak Moments: Capturing the Highest Point of Each Cycle
Observing price snapshots on specific dates is far from sufficient to depict the full picture of an asset. Intrayear price fluctuations, especially the emergence of peak prices, reveal an asset’s potential explosive power and the "fear of missing out" (FOMO) that traders may face. The table below summarizes the highest prices reached by each asset within each annual cycle (from August 1 of the current year to July 31 of the following year).
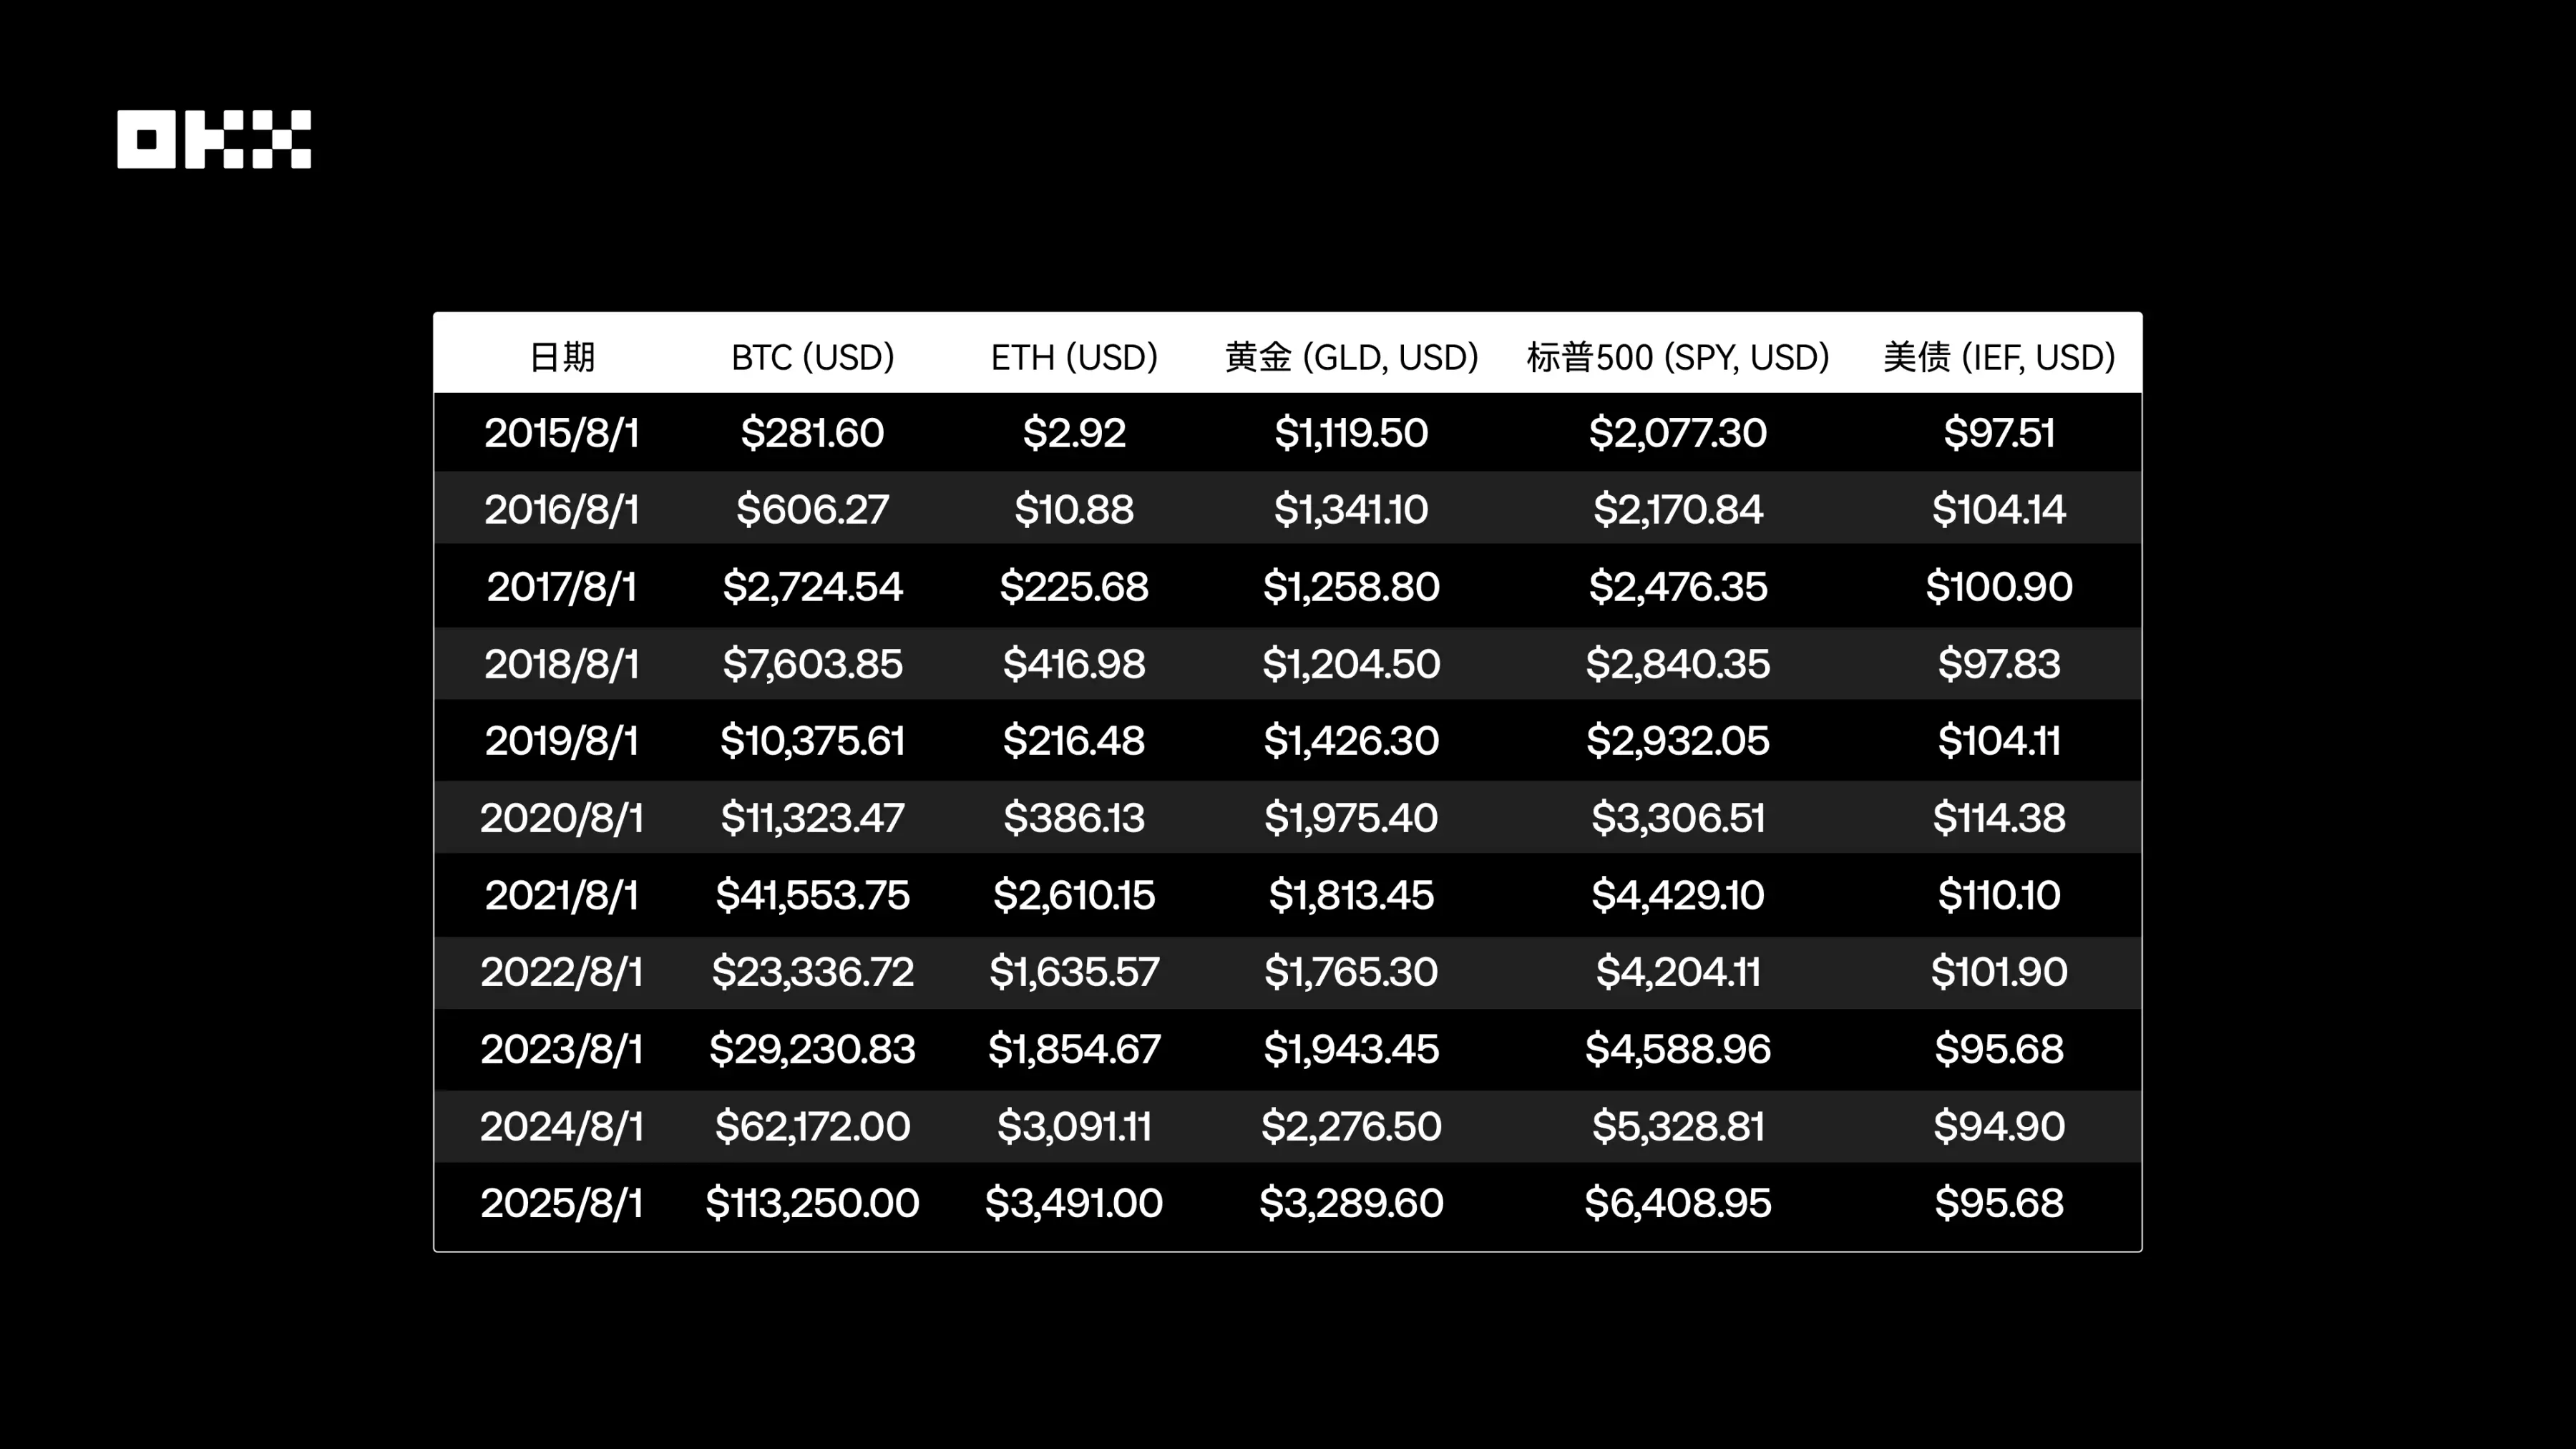
*Data Source: Ethereum was launched on July 30, 2015, and early data liquidity is low, so there may be certain errors. Other data is calculated based on daily historical data from Yahoo Finance.*
By examining the annual price peaks, we can clearly see the differences in the magnitude of asset growth. The price peaks of Bitcoin and Ethereum during bull markets show astonishing jumps. In contrast, the gaps between the annual highest prices and snapshot prices of the S&P 500 and gold are much smaller, reflecting their more mature and stable market characteristics.
### (III) Wealth Growth Simulation: The 10-Year "Fantasy Journey" of $10,000
To more intuitively understand the wealth creation capabilities of different assets, we simulated a simple experiment: On August 1, 2015, $10,000 was invested in each of the five assets and held until August 1, 2025. The chart below shows the cumulative value changes of this investment using a logarithmic scale, which better handles data with huge magnitude differences and prevents the curves of high-growth assets from being too steep to obscure details of other assets.
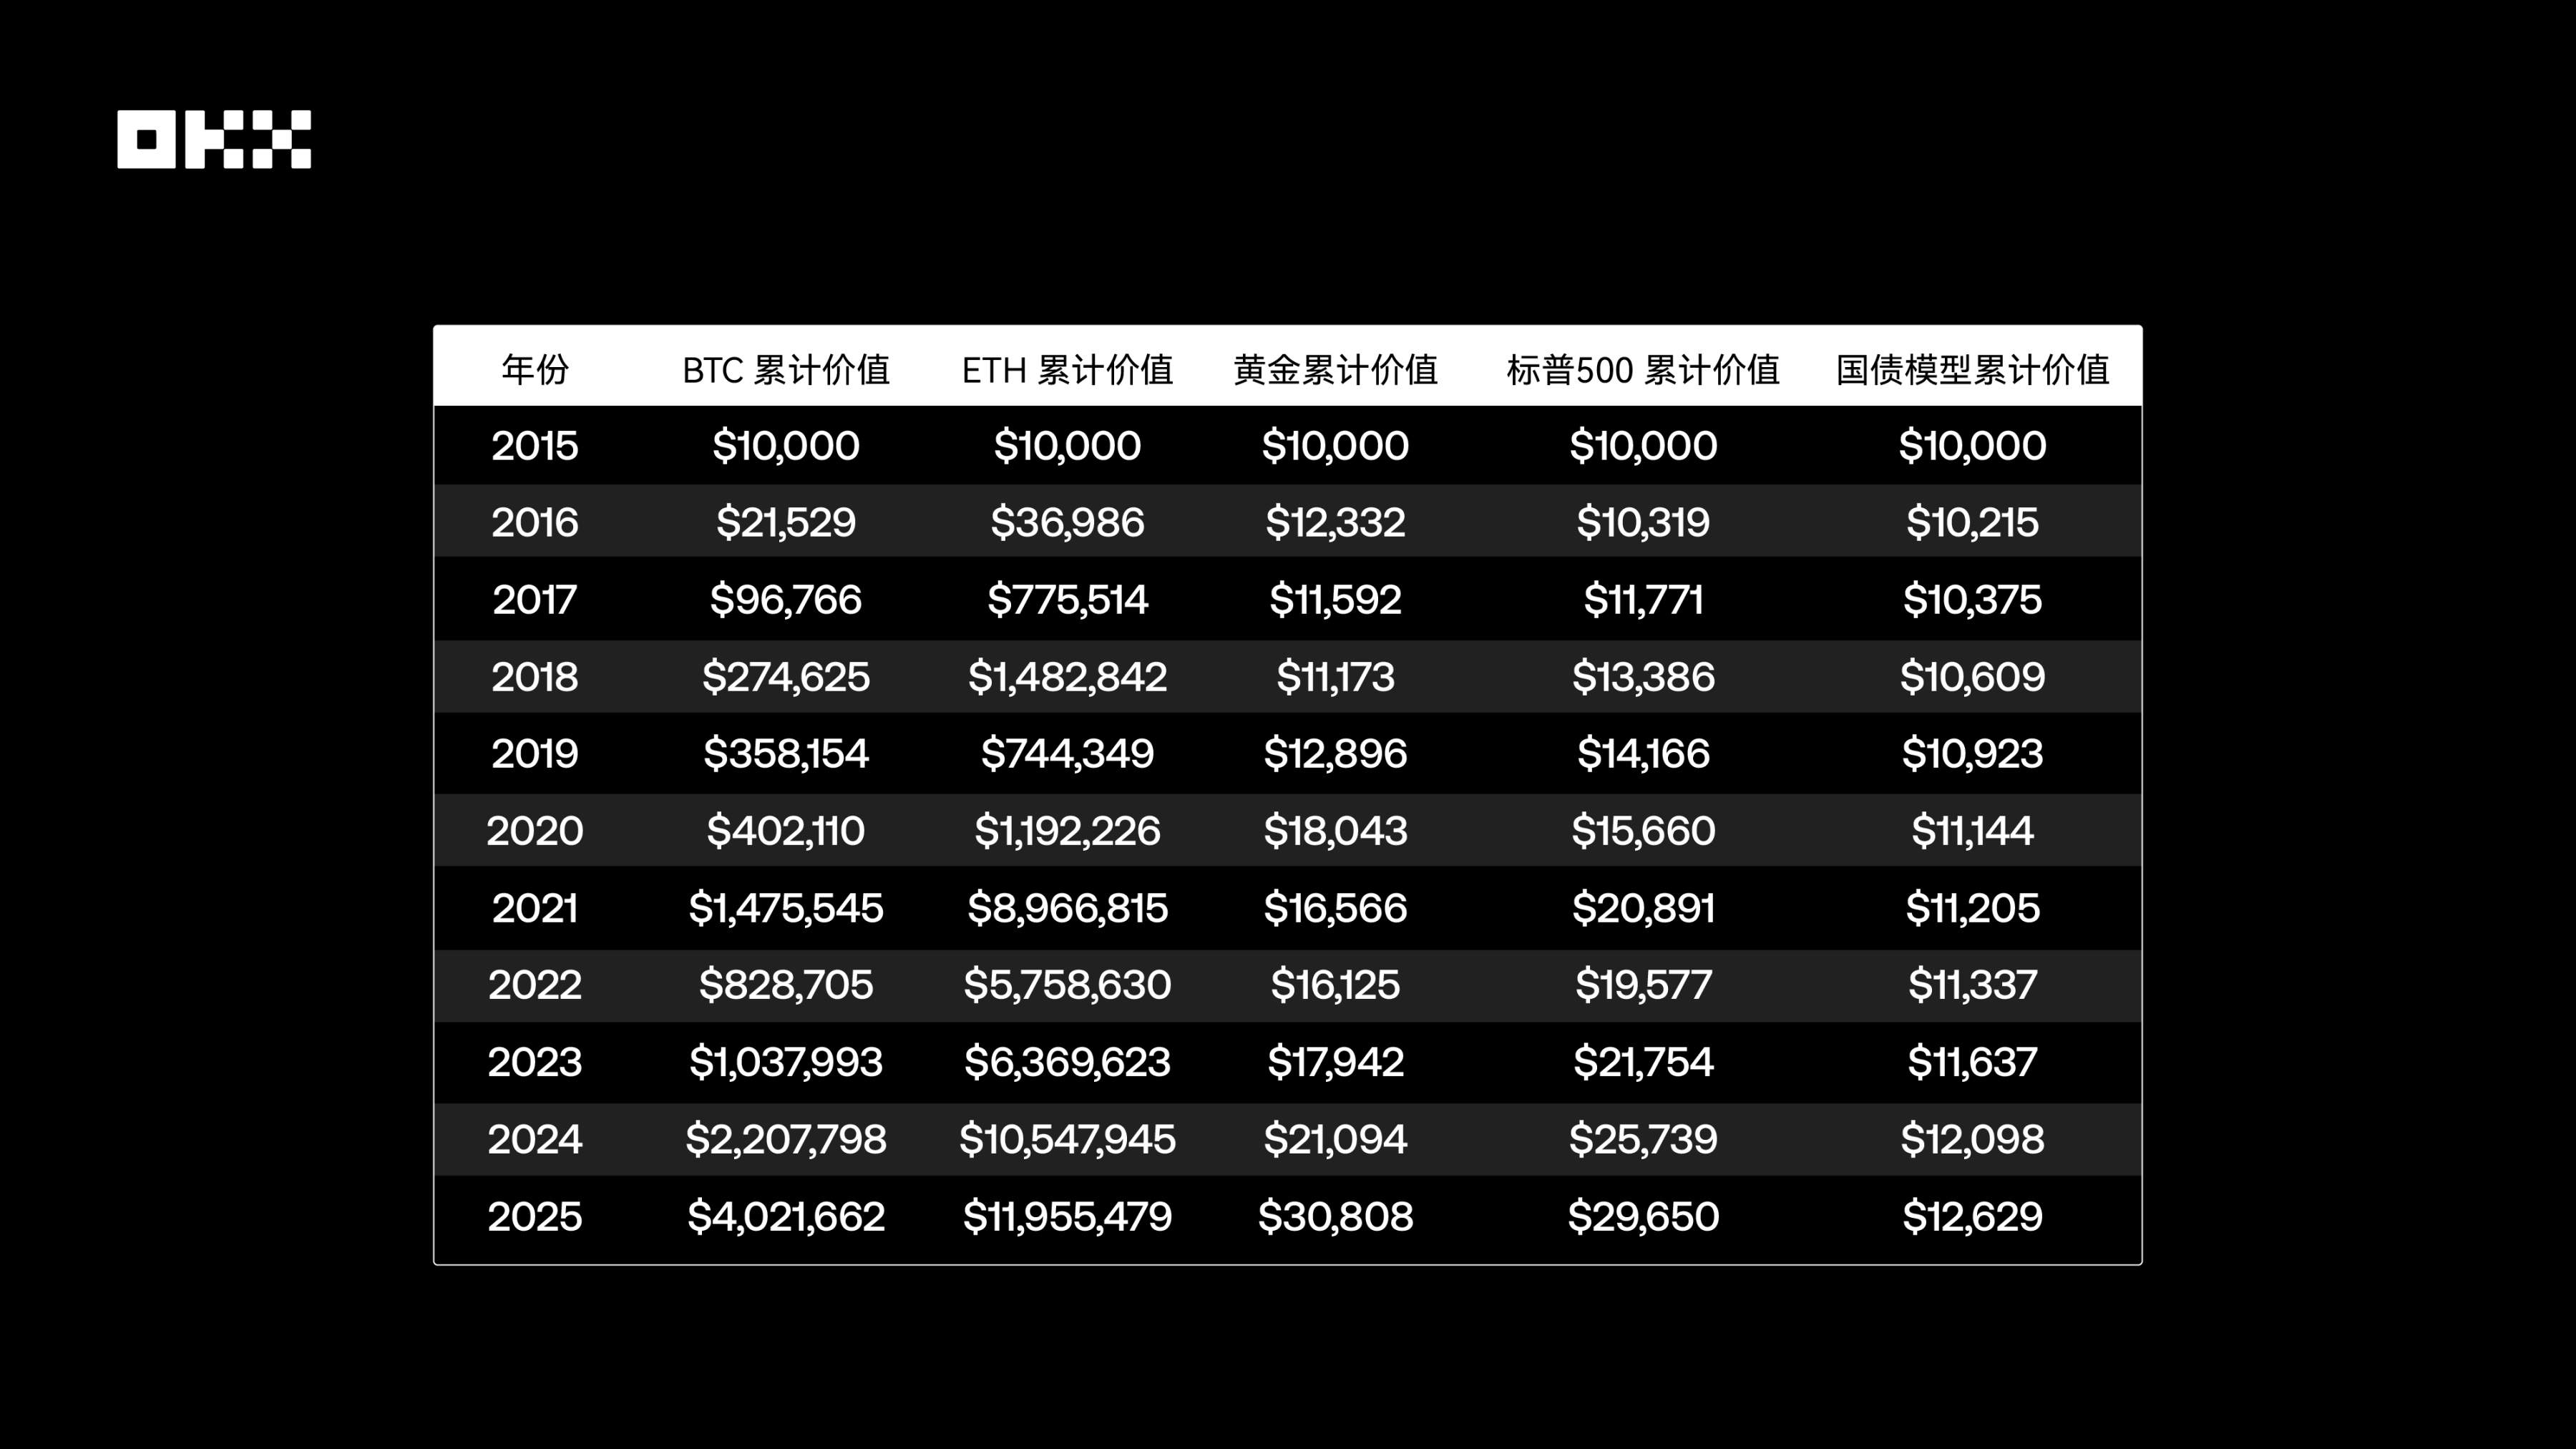
*Data Source: Yahoo Finance, FRED, Macrotrends, etc.*
The table shows that between 2015 and 2025, the growth multiples of different assets were as follows: BTC increased by 402.17 times, with a 10-year cumulative return of approximately $4.02 million; ETH rose by 1195.55 times, with a 10-year cumulative return of about $11.95 million; gold grew by 3.08 times, with a 10-year cumulative return of around $30,000; the S&P 500 gained 2.97 times, with a 10-year cumulative return of roughly $29,600; and U.S. Treasury bonds increased by 1.26 times, with a 10-year cumulative return of only about $12,600.
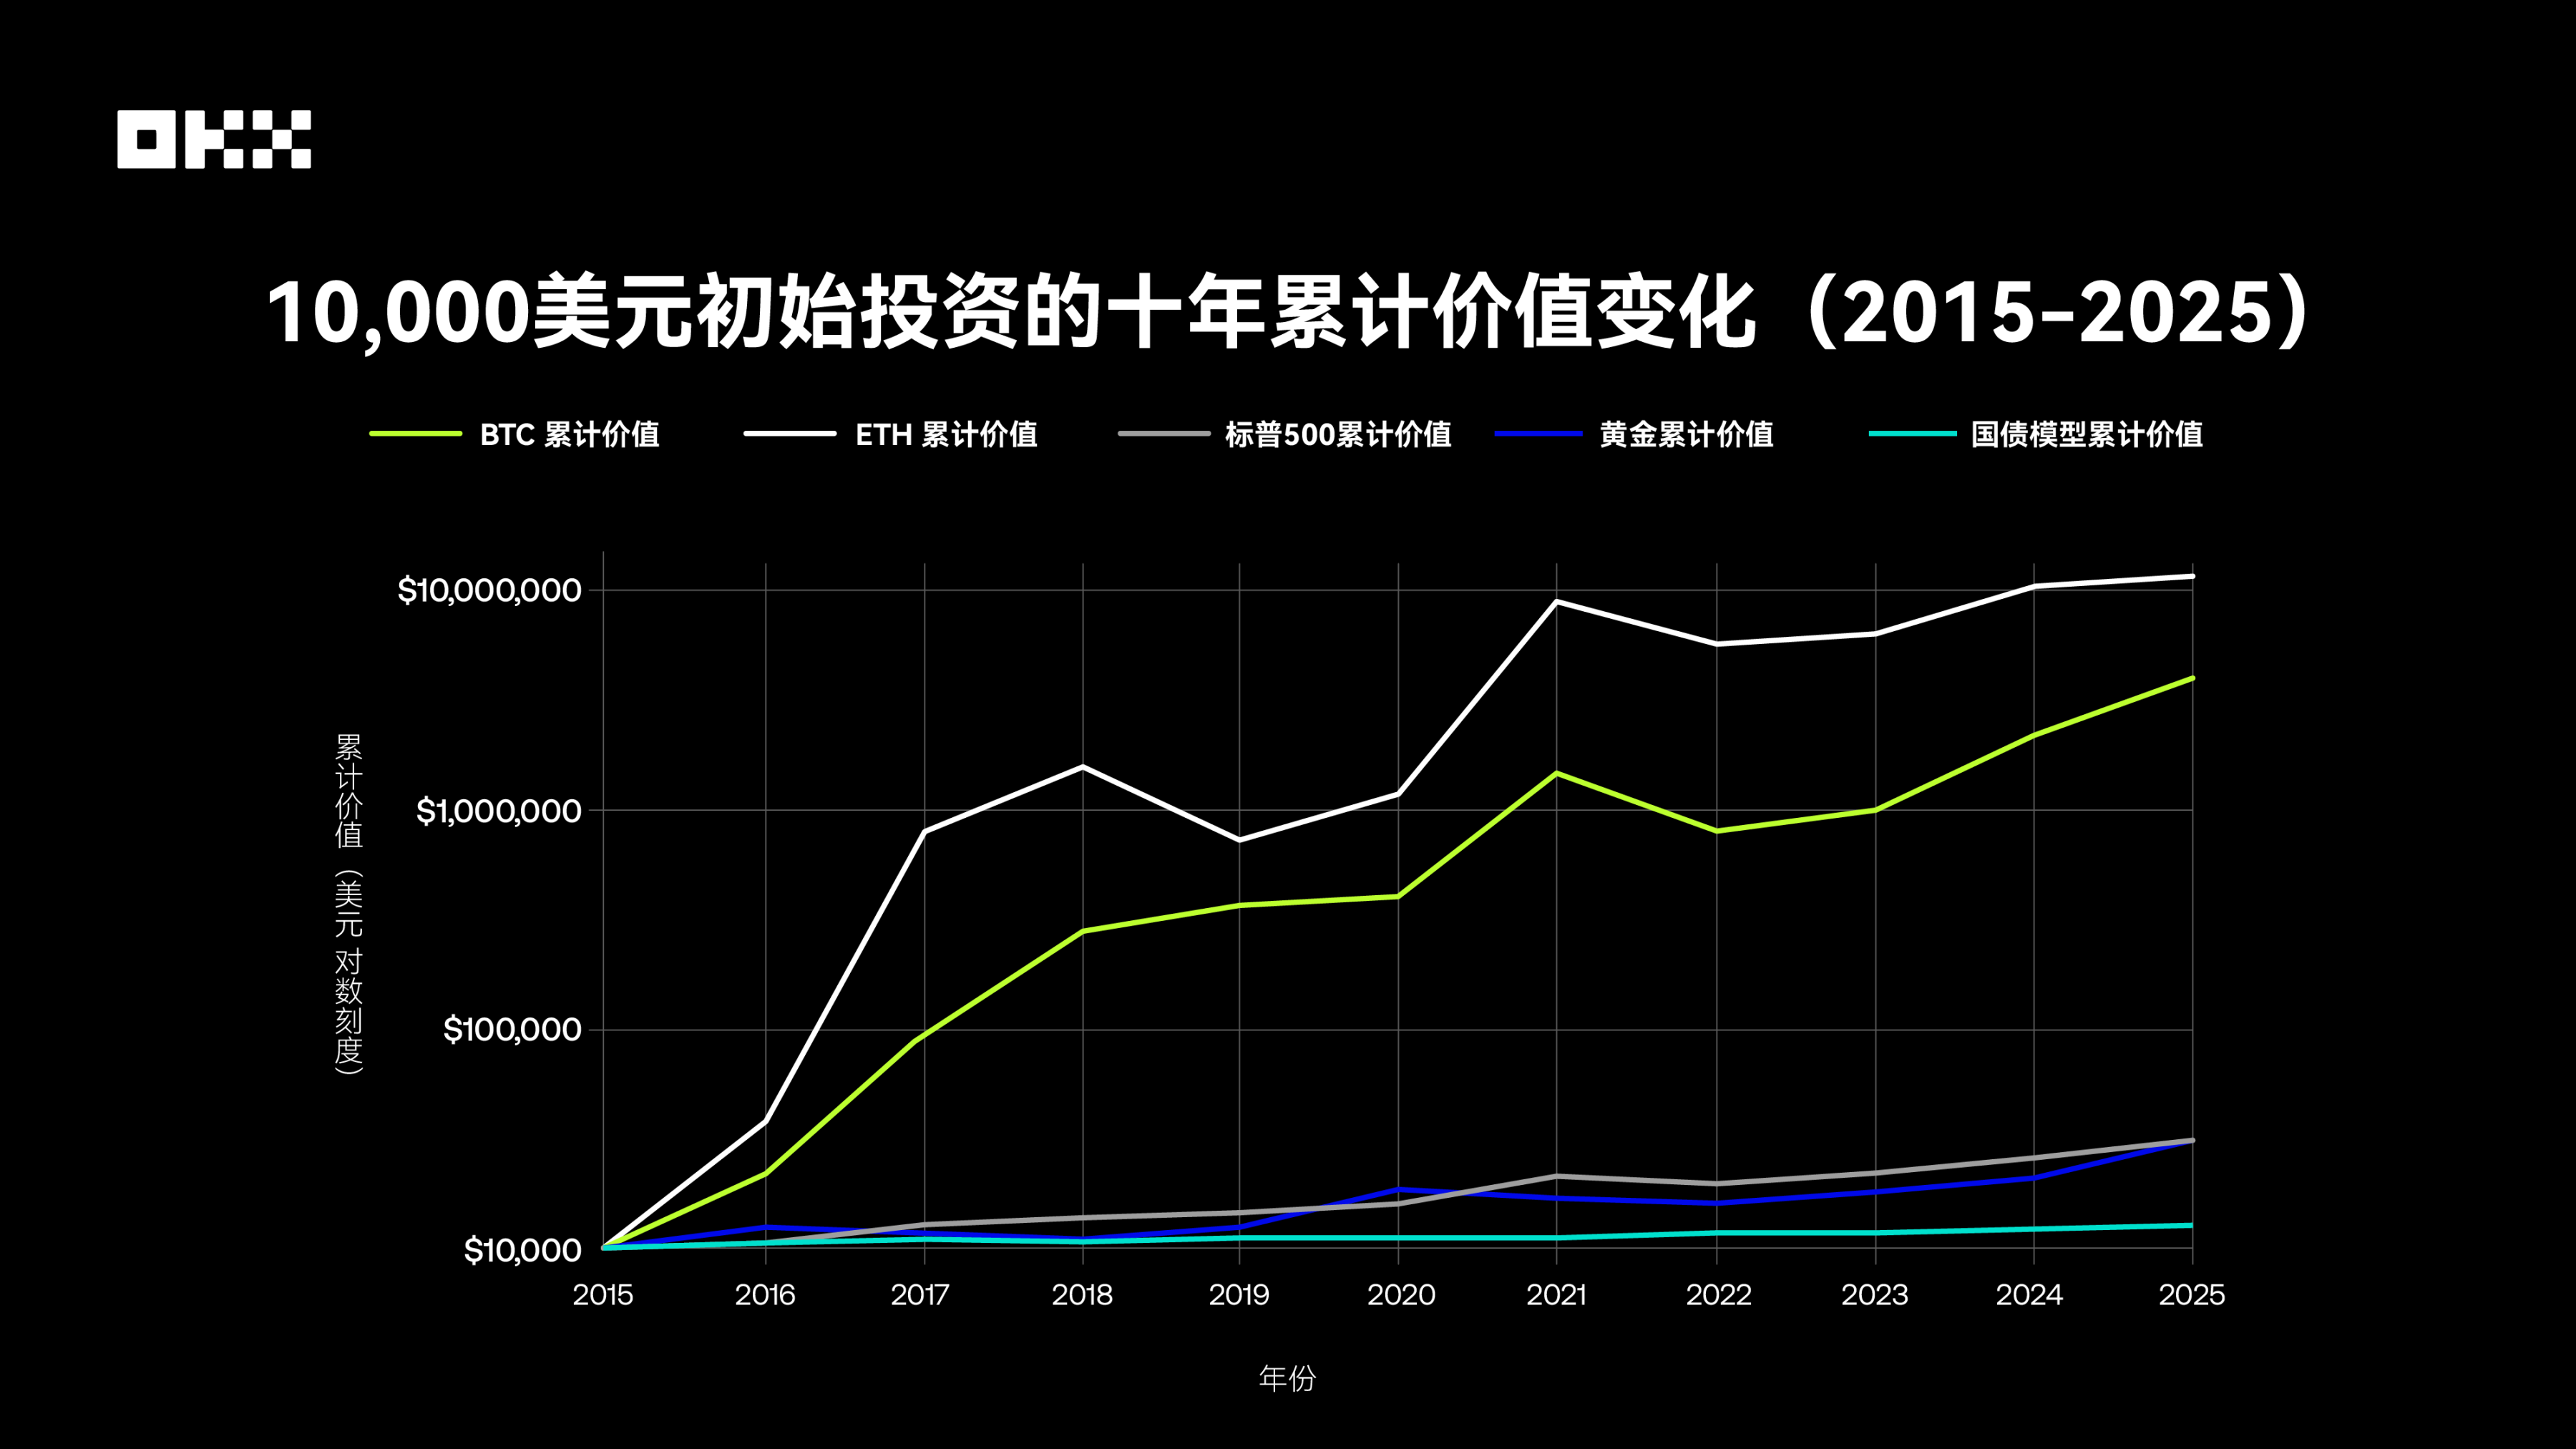
Among them, Bitcoin and Ethereum have demonstrated astonishing wealth growth effects, with return rates far exceeding traditional assets, reaching 100-fold or even 1,000-fold magnitudes. This reflects the asymmetric return potential of emerging technology assets under high risks, which is unimaginable in the traditional financial world. In comparison, the S&P 500 has tripled investments through stable compound growth, gold has mainly played a role in preserving value, and U.S. Treasury bonds have almost stagnated over 10 years after experiencing a full cycle of low and high interest rates, highlighting the constraints of interest rate risks on the long-term performance of bond assets.
## Maximum Drawdown: How High Are the Risks Behind Returns?
No asset can lead forever, and return rates are only the beginning of the story. A mature trader is more concerned about the quality of returns—i.e., the level of risk taken to achieve those returns. Therefore, understanding the risk characteristics of different assets is equally important as understanding their return potential. Three core indicators—volatility, maximum drawdown, and Sharpe ratio—enable a more comprehensive evaluation of the true "cost-effectiveness" of various assets. Volatility, usually measured by standard deviation, reflects the magnitude of asset price fluctuations. Maximum drawdown, on the other hand, measures the maximum decline in an asset’s price from its historical peak to the subsequent trough. It is an intuitive indicator for measuring downside risk and is directly related to traders’ psychological tolerance limits and the viability of their portfolios.
*Data Source: Bloomberg, S&P Global, Yahoo Finance, etc.*
The volatility of cryptographic assets is far higher than that of traditional assets. According to data from Digital One Agency, the annualized standard deviation of Bitcoin is approximately 70%-90%, while that of the S&P 500 Index is only 15%-20%. This huge volatility has directly led to astonishing maximum drawdowns: Over the past 10 years, Bitcoin and Ethereum have experienced multiple deep drawdowns of over 70%. For example, during the 2018 bear market, Bitcoin’s price plummeted from nearly $20,000 to approximately $3,000, representing a drawdown of over 80%. The S&P 500’s largest drawdown occurred in the early stages of the COVID-19 pandemic in 2020, at around -34%, and during the 2008 financial crisis, the drawdown exceeded 50%. Gold has performed relatively stably, with a maximum drawdown of approximately -29% over the past 15 years. U.S. Treasury bonds, as safe-haven assets, have the smallest drawdown range, but they also experienced a maximum drawdown of about -23% during the post-2020 rate-hiking cycle due to interest rate cycle effects, breaking the myth of their "risk-free" status.
This data is alarming. Users of Bitcoin and Ethereum must be able to withstand asset shrinkage of over 80% or even 90% and wait for more than two to three years to recover their losses.
In addition, to comprehensively evaluate risks and returns, we also introduced the Sharpe ratio and Calmar ratio. The Sharpe ratio, proposed by Nobel laureate William Sharpe, is the world’s most classic risk-adjusted return indicator. It measures how much excess return above the risk-free rate an investor can obtain for each additional unit of total risk (measured by volatility). A higher Sharpe ratio indicates better return performance and higher trading efficiency of the asset when taking on the same level of risk.
The Calmar ratio is another important risk-adjusted return indicator, but it focuses more on measuring the downside risk of an asset. It is calculated as the ratio of the annualized return rate to the historical maximum drawdown. A higher Calmar ratio means the asset has stronger "recovery ability" or "cost-effectiveness" in terms of returns when enduring the worst historical drawdowns. This indicator is particularly favored by users who prioritize risk control.
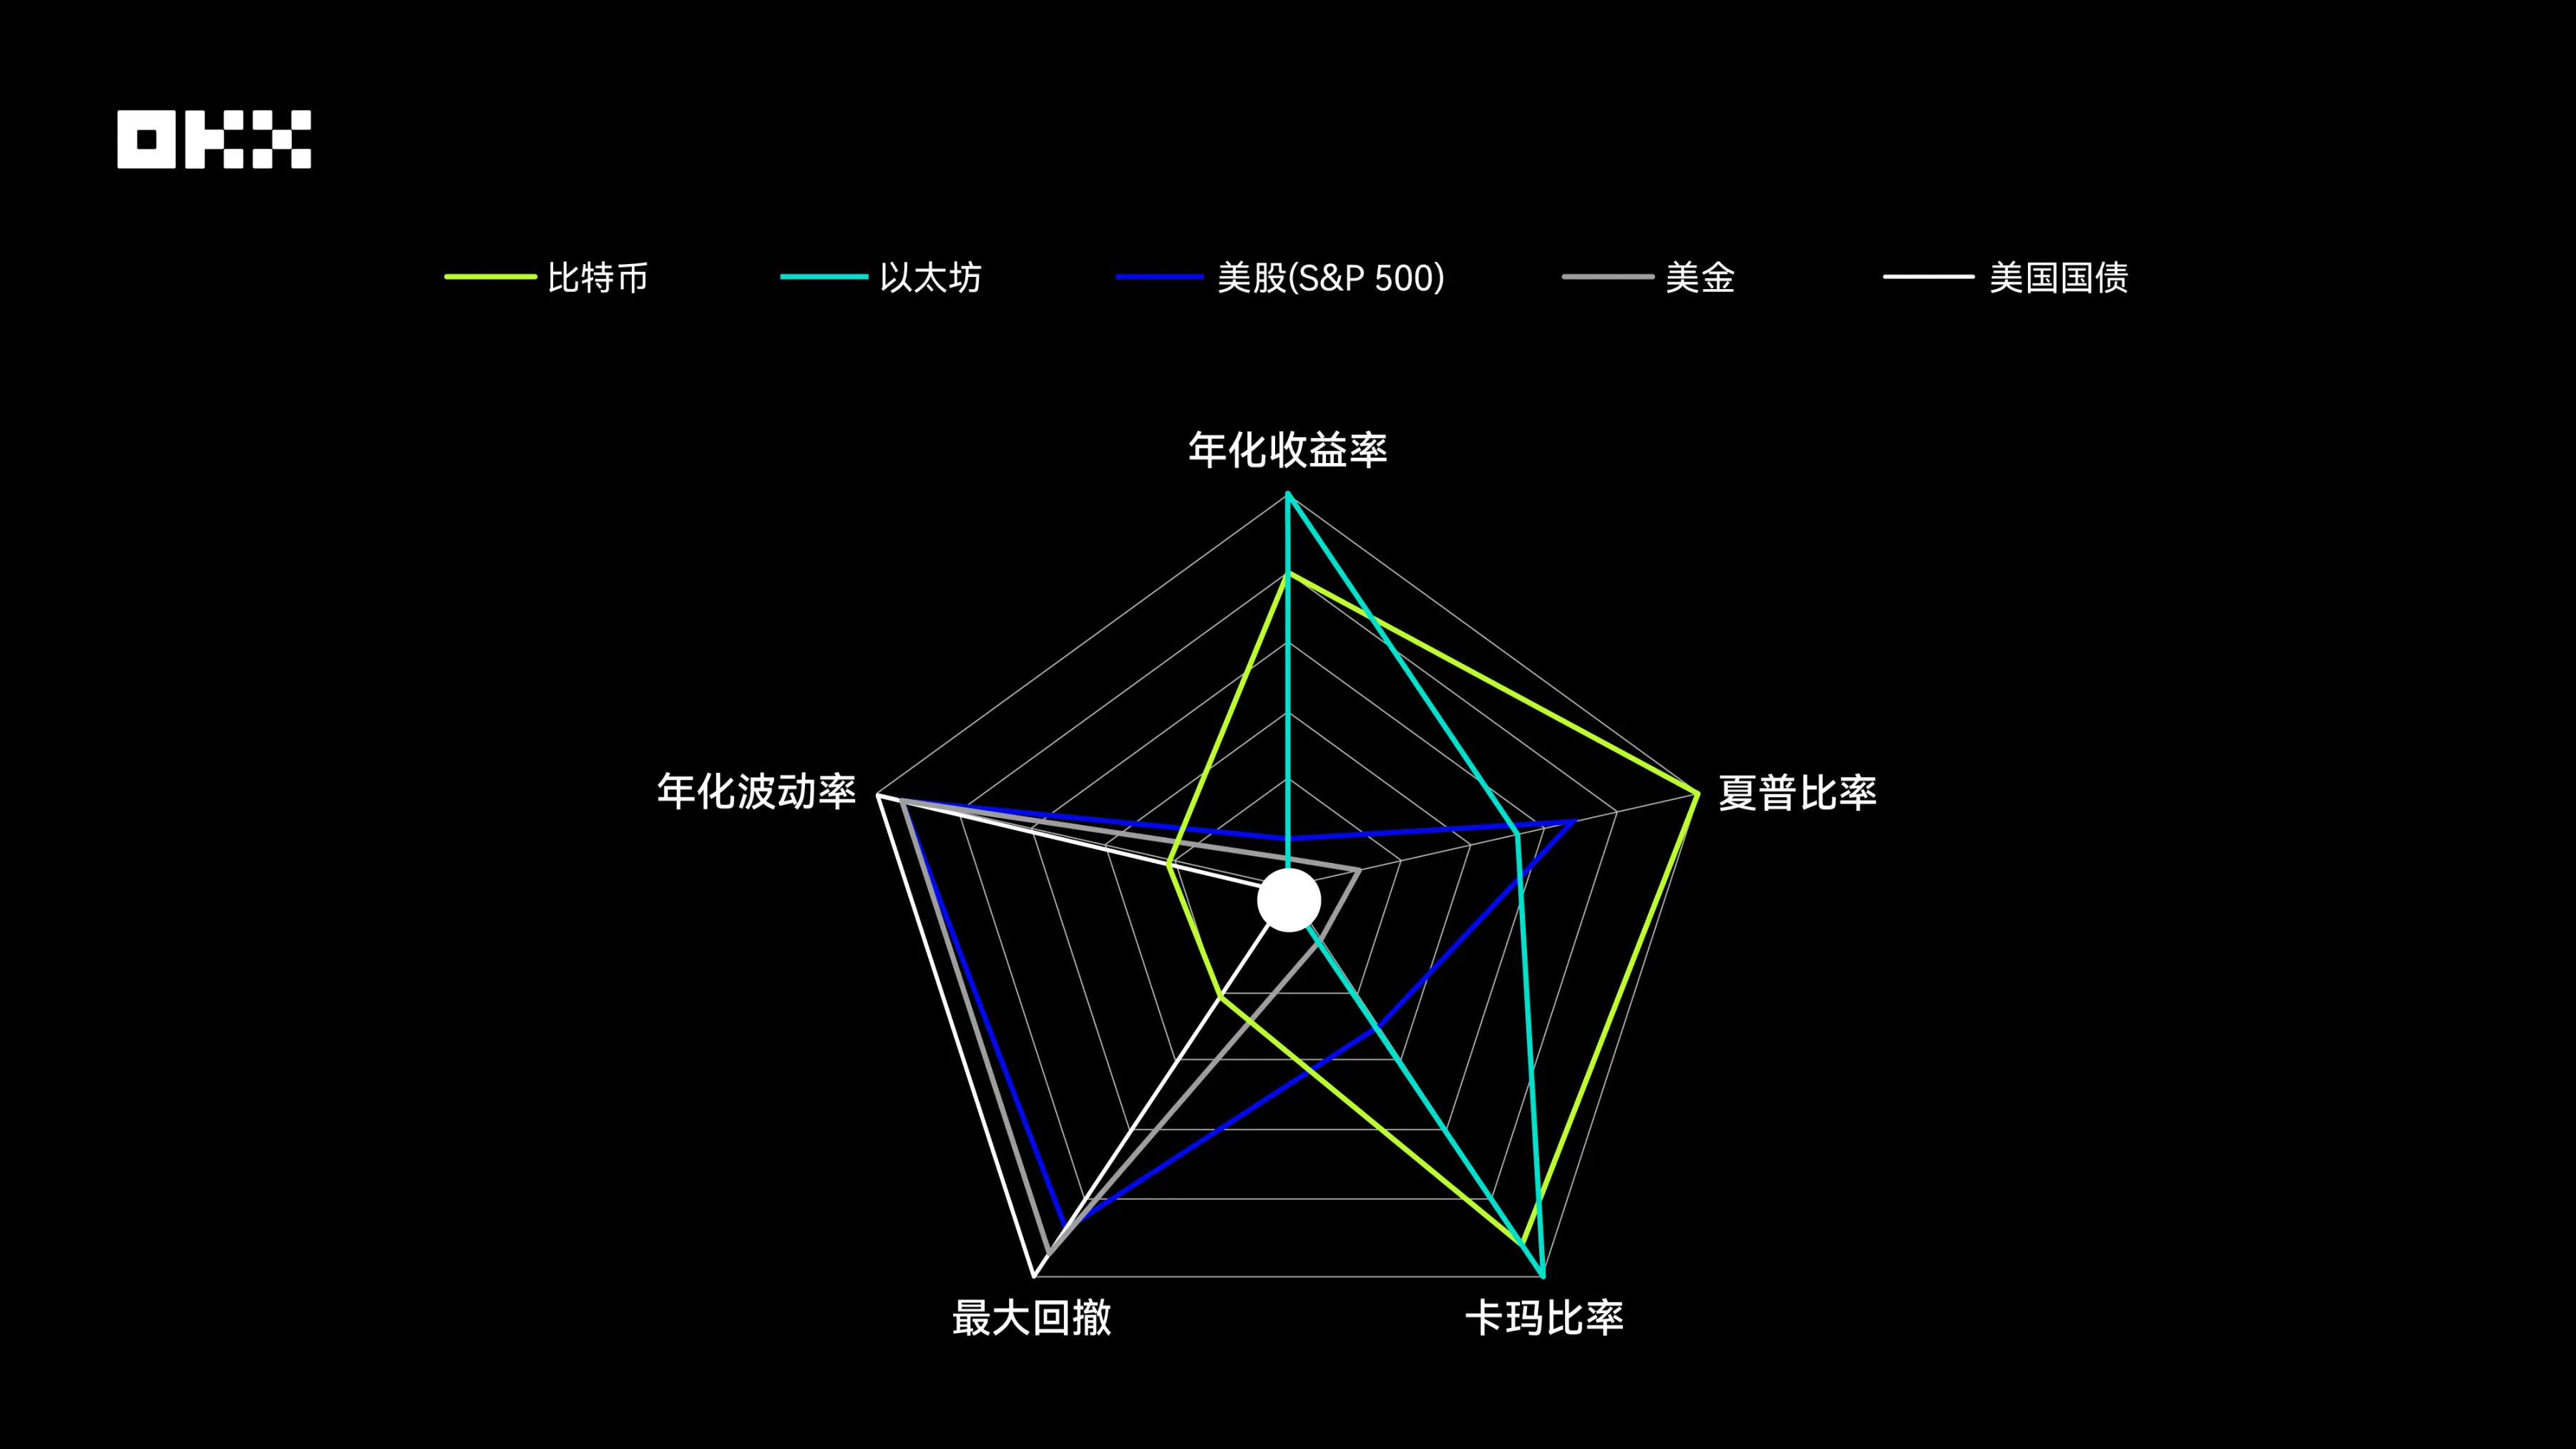
- **Bitcoin and Ethereum**: Their radar charts have the most "aggressive" shape. They show unparalleled advantages in two dimensions—annualized return rate and Calmar ratio—forming two outward-pointing "corners," which reflects their astonishing wealth growth effects and strong post-drawdown recovery capabilities over the past decade. However, this high return comes at a cost. In the two dimensions of maximum drawdown and annualized volatility, their scores are the lowest among all assets, meaning their charts shrink significantly in these directions, creating obvious "shortcomings." This clearly reveals the high-risk, high-volatility nature of cryptographic assets. Notably, Bitcoin’s Sharpe ratio performance is better than Ethereum’s, indicating that Bitcoin has slightly higher investment efficiency after risk adjustment.
- **U.S. Stocks (S&P 500)**: Its radar chart presents a relatively balanced pentagon with a considerable coverage area. It has no obvious shortcomings in all five dimensions, nor does it have extreme strengths. Its Sharpe ratio performance is outstanding, second only to Bitcoin, showing excellent risk-adjusted returns. At the same time, its annualized return rate is stable, and volatility and maximum drawdown are well-controlled, far outperforming cryptographic assets. This depicts a typical "backbone" image: it can not only provide considerable long-term returns but also control risks within a relatively reasonable range, making it the cornerstone of portfolio construction.
- **Gold**: Its radar chart is biased toward the risk control dimension. It scores relatively high in terms of annualized volatility and maximum drawdown, indicating that its price is relatively stable and it has strong resistance to declines. However, in the three return-related dimensions—annualized return rate, Sharpe ratio, and Calmar ratio—gold’s performance is relatively mediocre. This is fully consistent with gold’s positioning as a traditional safe-haven asset: it is not a tool for pursuing high growth but rather provides value preservation and risk hedging functions during market turmoil. The small area of its chart also reflects its low comprehensive return efficiency.
- **U.S. Treasury Bonds**: Its radar chart has the smallest area among all assets, with a shape that is concentrated toward the center. It scores the highest in the two risk dimensions of annualized volatility and maximum drawdown, showing extremely strong stability. However, its scores in all return-related dimensions are at the bottom. This clearly indicates that against the macro backdrop of declining interest rates over the past decade, U.S. Treasury bonds have mainly played a role in capital preservation and providing liquidity. They serve as a "ballast" in portfolios rather than a return driver. The contrast between their extremely low risk and extremely low return is striking.
## Inter-Asset Correlation: How to Optimize Portfolios?
The core of portfolio diversification lies in including assets with low correlation. When one asset declines, another may rise or remain stable, thereby smoothing the volatility of the entire portfolio. When Bitcoin was first created, it had almost no correlation with traditional financial markets and was regarded as a perfect "diversification tool." However, this characteristic has changed significantly over the past decade, especially as the institutionalization process has accelerated.
The correlation coefficient measures the degree to which the prices of two assets move in the same direction, ranging from -1 (perfect negative correlation) to +1 (perfect positive correlation). An effective diversified portfolio is usually composed of assets with low or negative correlations. The table below synthesizes data from multiple research institutions to show the approximate correlations between various assets over this decade.
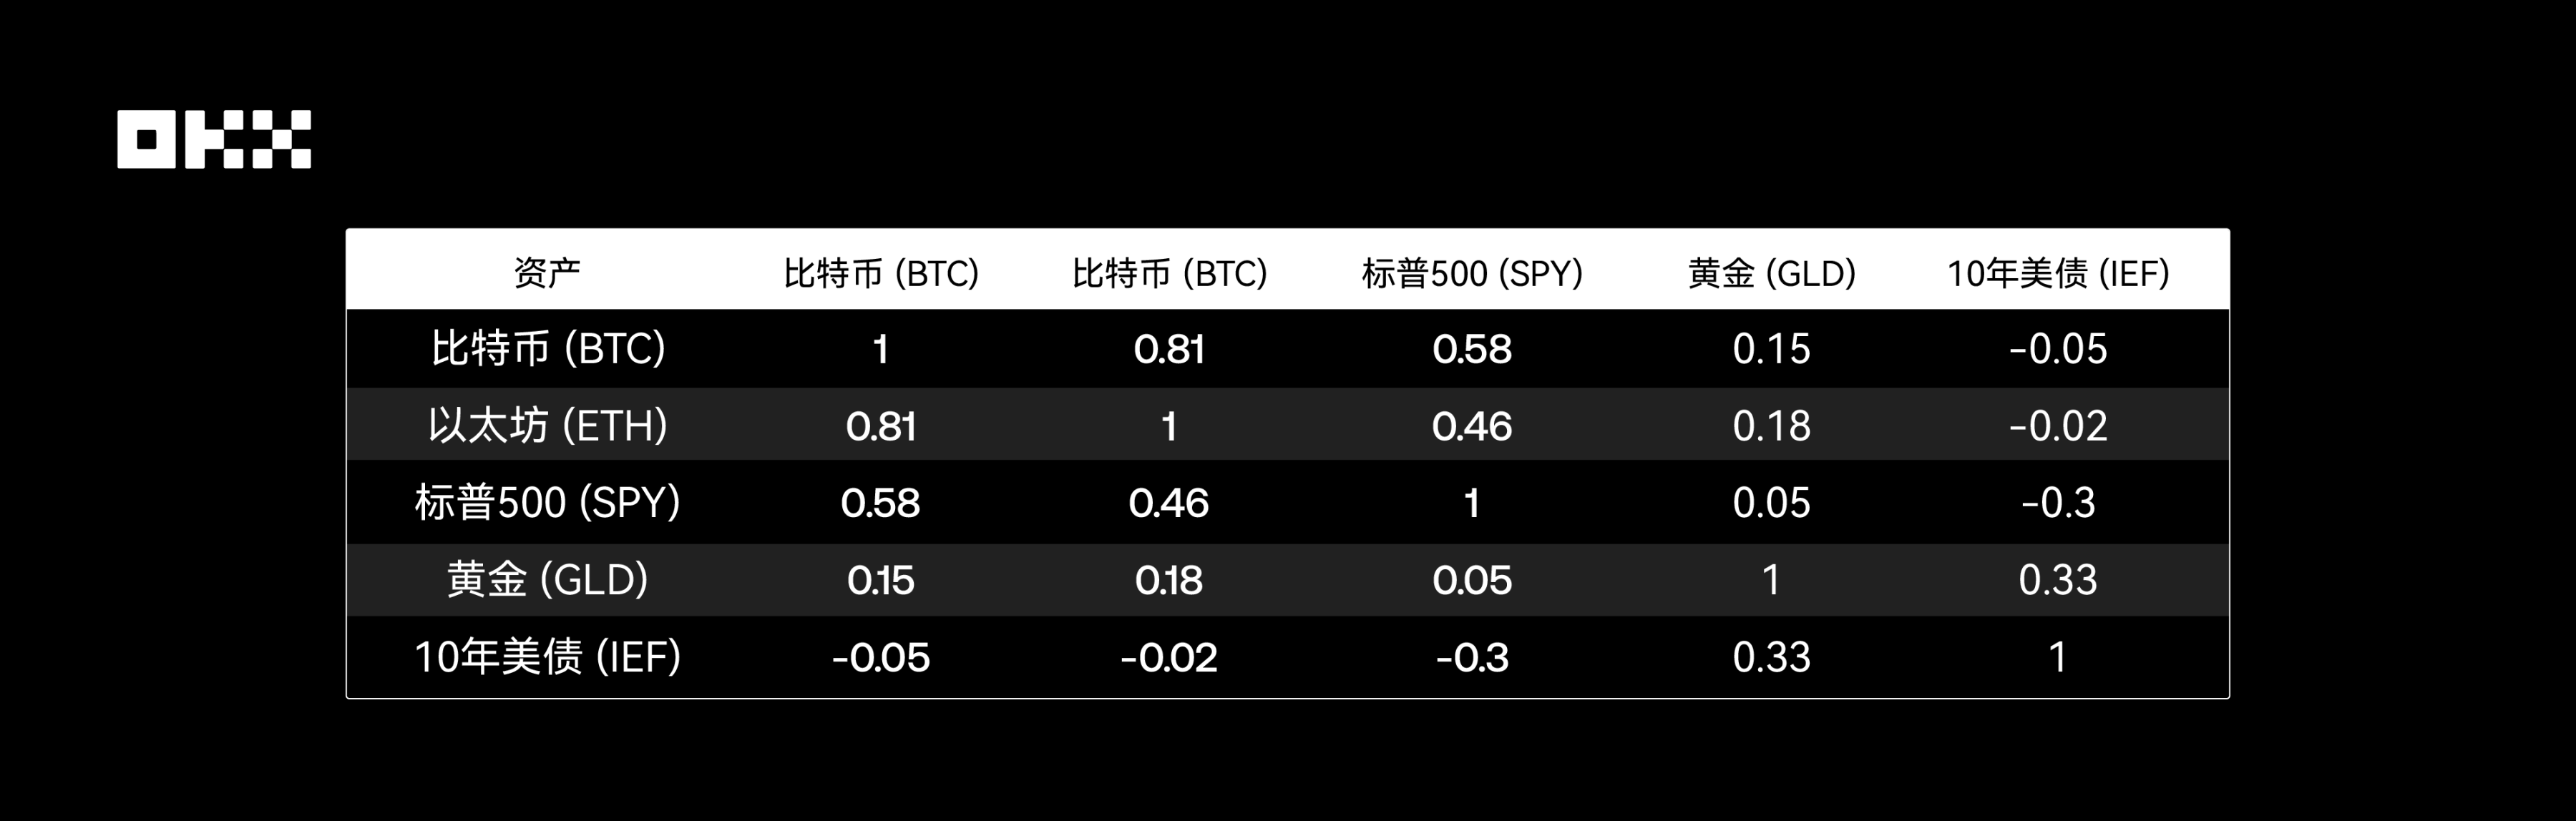
*Data Source: Crypto Research Report, LSEG, Newhedge*
### Bitcoin vs. S&P 500: From Independence to Synchronization
This is one of the most important changes over the decade.
- **Before 2020**: The correlation between cryptographic assets and traditional assets was generally low and unstable, fluctuating between positive and negative, showing strong independence.
- **2020-2021**: During the pandemic and monetary easing period, as central banks around the world injected large-scale liquidity, the "rising tide lifts all boats" effect for all risky assets was significant. During this period, the correlation between Bitcoin and the S&P 500 (especially tech stocks) rose sharply, once exceeding 0.6, showing a strong "coupling" phenomenon. This indicates that in a market driven by macro liquidity, Bitcoin is more like a high-beta risky asset rather than a safe-haven tool.
- **2022-2023**: During the rate-hiking and tightening cycle, as the Federal Reserve launched an aggressive rate-hiking cycle, risky assets generally came under pressure. The correlation between Bitcoin and the S&P 500 remained at a high level, with both declining together. However, its negative correlation with the U.S. Dollar Index (DXY) significantly strengthened, and Bitcoin prices often came under pressure when the U.S. dollar strengthened.
- **2024-2025**: The ETF era—the approval of U.S. spot Bitcoin ETFs is regarded as a structural inflection point. On the one hand, it has strengthened the connection between the cryptocurrency market and the traditional financial system; on the other hand, the continuous capital inflows brought by ETFs may also become a pricing factor independent of macro sentiment, leading to changes in correlation again. Data shows that after the approval of ETFs, the correlation between Bitcoin and the S&P 500 has decreased, showing signs of partial "decoupling."
### Bitcoin vs. Gold: Challenges to the "Digital Gold" Narrative
Although Bitcoin is known as "digital gold" due to its fixed supply, data shows that its safe-haven attributes and correlation with physical gold are not stable. Research by the European Securities and Markets Authority (ESMA) points out that there is no clear stable relationship between the two. Especially during market panics, Bitcoin often declines along with risky assets, rather than providing shelter like gold.
### Correlations Within Traditional Assets
The classic negative or low correlations between gold, U.S. Treasury bonds, and the S&P 500 remain the cornerstone of traditional asset allocation, providing important stability to portfolios.
## Major Event Impacts: How Did the Five Assets Perform?
Average values over a long cycle may obscure extreme performance at critical moments. By conducting "slice" analysis of several major events, we can gain a deeper understanding of the true "stress responses" of various assets.
# (I) March 2020: COVID-19 Black Swan Event – Indiscriminate Selling Across Global Markets
In March 2020, the COVID-19 pandemic triggered panic in global financial markets, a period historically known as the "Black March." Amid this extreme liquidity crisis, nearly all assets faced indiscriminate selling. The S&P 500 Index plummeted into a bear market in just 16 trading days, setting a record for the fastest decline in history, with a maximum drawdown of -34%. Bitcoin was also not spared – its price crashed by nearly 50% in a single day on March 12, falling from approximately $8,000 to below $4,000. Gold (GLD) also failed to remain fully unscathed, dropping in the short term as investors sold assets to secure U.S. dollar liquidity. Only U.S. Treasury bonds, acting as the ultimate safe haven, maintained stable prices. This event profoundly revealed that during extreme "de-risking" phases, asset correlations converge toward 1, and Bitcoin’s narrative as a "digital safe haven" proved fragile in the face of liquidity depletion.
# (II) May & November 2022: Crypto-Native Crises – Devastating Impacts of the LUNA/FTX Collapses
2022 was labeled the "Year of Disaster" for the crypto industry. In May, the collapse of algorithmic stablecoin TerraUSD (UST) and its sister token LUNA erased nearly $50 billion in market value within days. In November of the same year, the sudden bankruptcy of FTX – the world’s second-largest crypto exchange – further amplified market panic. These two incidents were typical examples of "endogenous" crises in the crypto sector. Research shows that after the FTX collapse, the prices of Bitcoin and Ethereum both fell by over 20%, while assets closely tied to the FTX ecosystem suffered even steeper declines. However, traditional financial assets such as gold, the S&P 500, and U.S. Treasury bonds remained almost unaffected during these events, clearly demonstrating a risk barrier between the crypto market and traditional finance. This indicates that crypto assets face not only macroeconomic risks but also unique and potentially more destructive risks related to internal protocols, platforms, and trust.
# (III) 2020–2025: Cycle of Macroeconomic Policy Shifts – The Tide of Liquidity
The Federal Reserve’s monetary policy serves as the "master valve" for global liquidity. During the 2020–2021 period of large-scale quantitative easing and zero-interest-rate policies, abundant liquidity flooded into risky assets, driving both Bitcoin and the S&P 500 into major bull markets. However, since the Federal Reserve launched an aggressive rate-hiking cycle in March 2022 to combat inflation, global liquidity has tightened, and the prices of risky assets have fallen in response. Academic research indicates that Bitcoin’s price sensitivity to Federal Reserve interest rate decisions and monetary policy uncertainty (MPU) has increased significantly since 2020. This reaffirms that Bitcoin has become deeply integrated into the macro-financial framework, with its price fluctuations closely linked to market expectations of Federal Reserve policies.
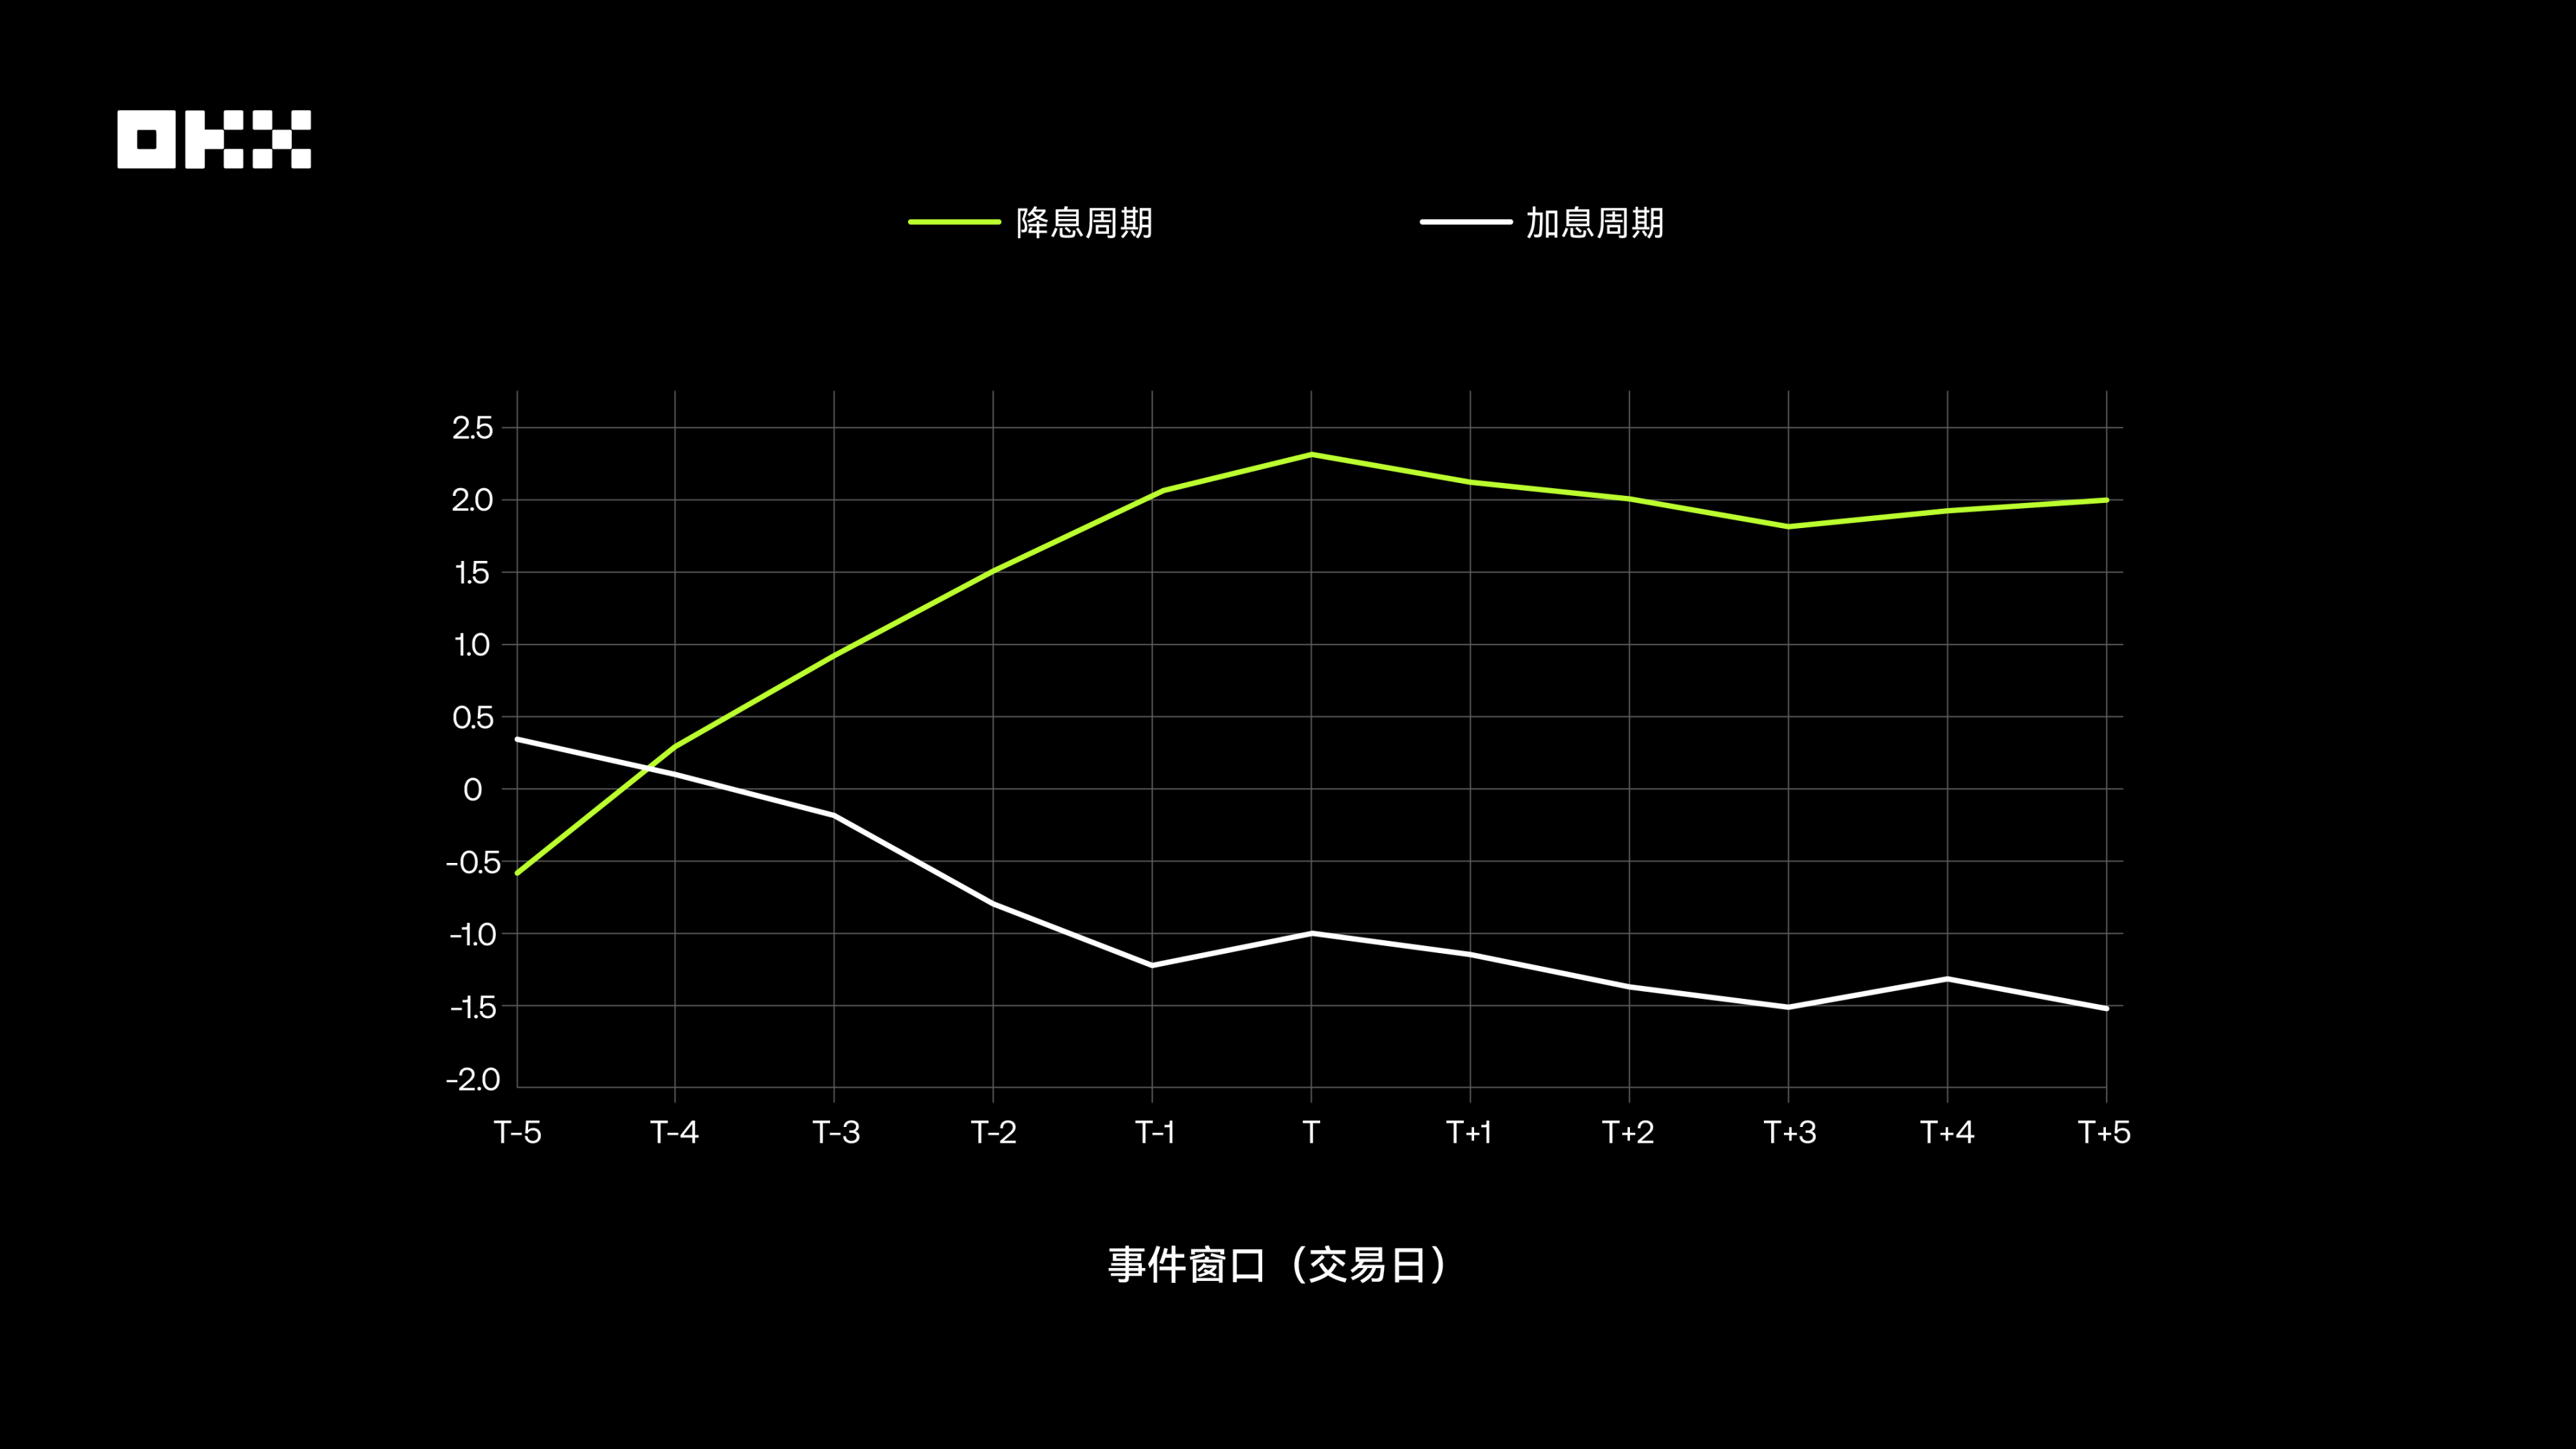
Furthermore, studies have found that the Bitcoin market exhibits distinct "expectation trading" characteristics. Before an interest rate hike announcement, markets typically price in the expected hike in advance, putting downward pressure on Bitcoin’s price. Conversely, when expectations of an interest rate cut are strong, Bitcoin’s price tends to rise ahead of time. On the day of the policy announcement, if the outcome aligns with expectations, market reactions are usually muted. The most severe volatility stems from "interest rate surprises" – i.e., discrepancies between the Federal Open Market Committee (FOMC)’s decisions and market expectations priced in via tools such as interest rate futures.
The chart below illustrates Bitcoin’s average cumulative abnormal return (CAR) relative to the S&P 500 during the event window (Days T-5 to T+5) surrounding interest rate hikes and cuts. It can be observed that during rate-cut cycles, Bitcoin achieves significant positive abnormal returns before the announcement, whereas during rate-hike cycles, such returns are negligible or even negative. This indicates that markets react more proactively and positively to expected rate cuts.
# (IV) January 2024: Approval of Spot Bitcoin ETFs – A Milestone Toward Mainstream Adoption
On January 10, 2024, the U.S. Securities and Exchange Commission (SEC) officially approved the listing of the first batch of spot Bitcoin ETFs, a milestone event regarded as advancing the legalization and mainstream acceptance of crypto assets. The launch of these ETFs has significantly lowered the barrier for traditional investors to access Bitcoin. Data shows that after the ETF approval, Bitcoin’s trading volume surged and capital inflows remained strong. Charts from Chainalysis reveal that after the ETF launch, daily trading volume approached $10 billion in March, with cumulative capital inflows growing far faster than those seen when the first gold ETF was launched in 2005. Beyond driving Bitcoin to new price highs, this event is structurally transforming Bitcoin’s investor base and market dynamics, forging an unprecedentedly close connection between Bitcoin and the traditional financial system.
# No Perfect Asset – Building a Cycle-Resilient Portfolio
Over the past decade, BTC/ETH have been undisputed "Kings of Growth," delivering ultra-high returns unmatched by any traditional asset. However, this returns come at the cost of extreme volatility and significant drawdowns. Their correlation with traditional markets is rising, weakening their value as a pure diversification tool. They are suitable for investors with extremely high risk tolerance and a long-term holding mindset.
The S&P 500 serves as the "ballast" of long-term portfolios. It delivers excellent, sustainable compound growth and exhibits the best balance in terms of risk-adjusted returns (both Sharpe ratio and Calmar ratio). While it experiences periodic corrections, its strong recovery ability and the backing of the real economy make it the absolute core of portfolio construction.
As an ancient store of value, gold offers limited absolute returns. Nevertheless, it remains an indispensable "insurance policy" amid macroeconomic uncertainty, geopolitical risks, and doubts about the fiat currency system. Its value in a portfolio lies not in offense, but in defense.
The traditional "safe haven" status of U.S. Treasury bonds has been severely challenged during the unprecedented rate-hiking cycle, reminding investors that "risk-free" is a relative concept. Even so, U.S. Treasury bonds remain among the world’s most liquid and highest-credit-rated assets, and their role as a foundation for providing stability and liquidity in portfolios is unlikely to be replaced in the short term.
This brings us to the answer to a classic question: Should investors choose a dollar-cost averaging (DCA) strategy or a lump-sum investment strategy?
In the long run, DCA offers significant advantages for highly volatile assets (BTC/ETH). By purchasing more shares when prices are low, DCA effectively smooths out costs, reduces timing risk, and ultimately yields substantial returns – with far less psychological stress than lump-sum investing.
For steadily growing assets (e.g., SPY, the S&P 500 ETF), lump-sum investments have outperformed DCA in most historical periods. This is because the stock market trends upward over the long term, and lump-sum investing allows funds to fully benefit from compound growth earlier.
For low-growth assets (e.g., GLD for gold, IEF for U.S. Treasury bonds), the final outcomes of the two strategies differ minimally, and neither delivers explosive returns. In conclusion, DCA is an effective strategy for managing highly volatile assets like Bitcoin, while lump-sum investing is generally preferable for equity markets with long-term steady growth. Whether you prefer basic DCA, intelligent arbitrage, short-term grid trading, or advanced signal-based or iceberg strategies, OKX Strategy Trading provides a one-stop solution to meet your needs.
The "holy grail" of asset allocation is not to find a single "best asset," but to deeply understand and skillfully combine the unique characteristics of different assets. A resilient portfolio should leverage the growth potential of crypto assets to pursue excess returns, rely on the depth of equity assets to drive long-term growth, and allocate gold and bonds for stability to hedge against unforeseen risks. A decade of data tells us: Markets are constantly evolving, and there are no eternal winners. The true "King of Assets" may not reside in any single asset class, but in a rational trading framework that enables a deep understanding and mastery of the characteristics of different assets.
# Disclaimer
The views expressed in this article are solely those of the author and do not constitute investment advice for this platform. This platform makes no guarantees regarding the accuracy, completeness, originality, or timeliness of the information contained in this article, nor shall it be liable for any losses arising from the use of or reliance on such information.
Contact: Sarah
Phone: +1 6269975768
Tel: +1 6269975768
Email: xttrader777@gmail.com
Add: 250 Consumers Rd, Toronto, ON M2J 4V6, Canada


 +1 6269975768
 微信
微信 Teams
Teams