X-trader NEWS
Open your markets potential
Bitcoin hit a record high and plummeted $7,000. Three major reasons for this cycle of reincarnation

On August 15th, Bitcoin suddenly plummeted after hitting a new all-time high of $124,500, with an intraday drop of 4.24% to a low of $117,000, causing the total market capitalization of the cryptocurrency market to evaporate by 3.9%. The plunge was mainly driven by the higher-than-expected surge in U.S. PPI data, intensifying market concerns about sticky inflation and the Federal Reserve delaying interest rate cuts. Meanwhile, the U.S. Treasury Secretary denied expanding Bitcoin's strategic reserves, and the disappointment over policy expectations further dampened market sentiment. Although the derivatives market remained calm, the technical double-top pattern and leveraged liquidations amplified the decline, exposing cryptocurrencies' vulnerability to macro policies and market sentiment.
Author: White55, Huoxing Finance
Ethereum
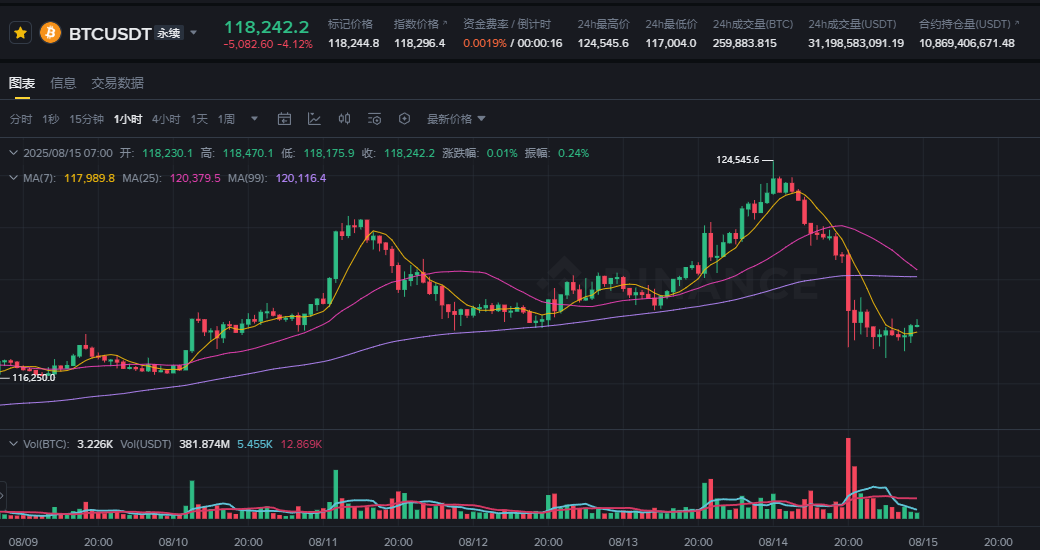
The Bitcoin market witnessed a thrilling scene on August 15th. Only a few hours after hitting a new all-time high of $124,500, Bitcoin's price suddenly reversed direction, plummeting sharply below the critical support level of $117,500. It recorded an intraday drop of 4.24%, with the lowest point touching $117,000. This drastic plunge of up to $7,000 was like a cold shower, dousing the newly ignited fervor in the market.
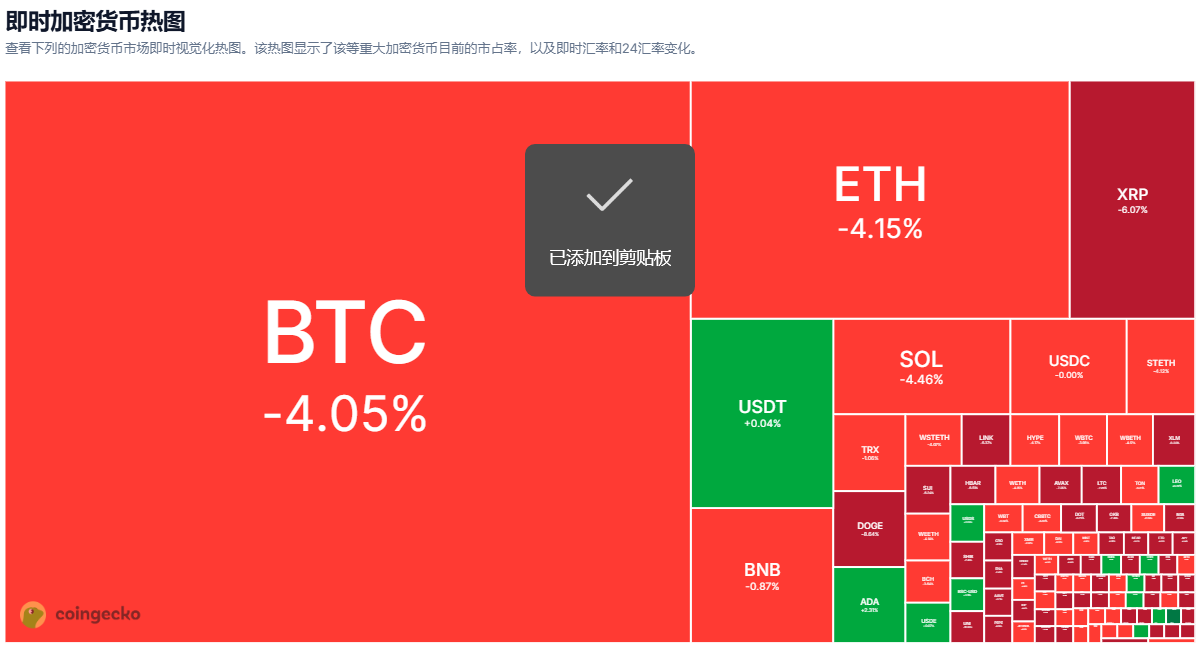
This flash crash was not an isolated incident. The total market capitalization of the cryptocurrency market evaporated by 3.9% in 24 hours, dropping to $4.09 trillion. Ethereum followed Bitcoin's decline, breaking below the $4,500 mark and currently trading at $4,568.
Even more severe was the altcoin market, where Ethereum ecosystem tokens such as REZ, SSV, and ORDI generally plummeted by over 15%, forming a full-scale collapse.
The Return of the Inflation Ghost: A Fatal Reversal in Macro Data

The unexpected turn in U.S. inflation data became the direct trigger for this round of decline. The July Producer Price Index (PPI) released on August 14th surged 3.3% year-on-year, far exceeding the market expectation of 2.5% and the previous value of 2.3%, marking the largest monthly increase since June 2022. This stood in stark contrast to the "moderate" CPI data released three days earlier – at that time, the overall July CPI fell to 2.9%, and the core CPI dropped to 3.2% for the fourth consecutive month, which had raised market expectations for the Federal Reserve to cut interest rates.
Deep Anxiety About Sticky Inflation
Traders' violent reaction to the PPI data stemmed from its leading indicator role for corporate costs and consumer prices. Higher producer prices will eventually be passed on to the consumer end, forcing companies to raise prices to maintain profit margins, forming an inflationary spiral. This signal quickly changed interest rate expectations: according to the CME FedWatch tool, although the market still expects a 90.5% probability of a rate cut in September, the probability of the interest rate falling below 3.75% by January 2026 has dropped from 67% a week ago to 61%. The possibility of the Federal Reserve delaying easing policies instantly drained the upward momentum of risky assets.
Warning Signals of Stock-Coin Divergence
What's more ironic is that traditional stock markets rebounded quickly after digesting the PPI data, with the S&P 500 index hitting new closing highs for three consecutive days, while Bitcoin was left alone in the sell-off vortex. This divergence in risky assets reveals the vulnerability of the cryptocurrency market – when liquidity expectations undergo subtle changes, crypto assets often bear the brunt of being sold for cash.
Disappointed Policy Expectations: The Dream of National Bitcoin Reserves Shattered
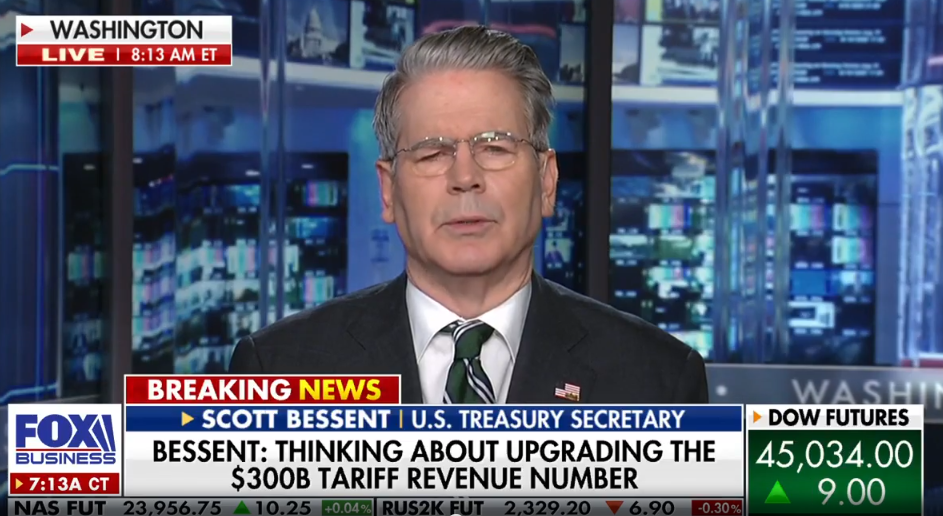
EthereumInterview with Scott Bessent. Source: Foxbusiness.com
While the Bitcoin community was still envisioning the U.S. government including it in strategic reserves, Treasury Secretary Scott Bessent poured cold water on the idea. In an interview with Fox Business News, he clearly stated: "The government has no plans to expand Bitcoin's strategic reserves" and categorically denied the possibility of allocating gains from the revaluation of national debt gold to Bitcoin.
Expectation Gap in Trump's Executive Order
This statement created a huge gap with market expectations. The executive order signed by Trump in March had explicitly mentioned a "budget-neutral strategy to buy more Bitcoin," igniting institutional investors' imagination of sovereign funds entering the market. Bessent's remarks not only shattered this expectation but also exposed divisions at the policy implementation level. When the "digital gold" narrative lacks sovereign credit endorsement, the rapid withdrawal of speculative funds becomes inevitable.
Chain Reaction of Regulatory Chill
Policy negatives formed a domino effect. Although the U.S. SEC dismissed lawsuits against some crypto projects, key legislations such as the "GENIUS Act" are still advancing, and the ambiguity of the regulatory framework remains like the Sword of Damocles. In addition, discussions on sovereign Bitcoin reserves in countries such as Germany and Japan are still on paper, and institutional funds in the regulatory vacuum have always hesitated to enter on a large scale.
Technical Collapse: Emerging Double Top and Leveraged Massacre
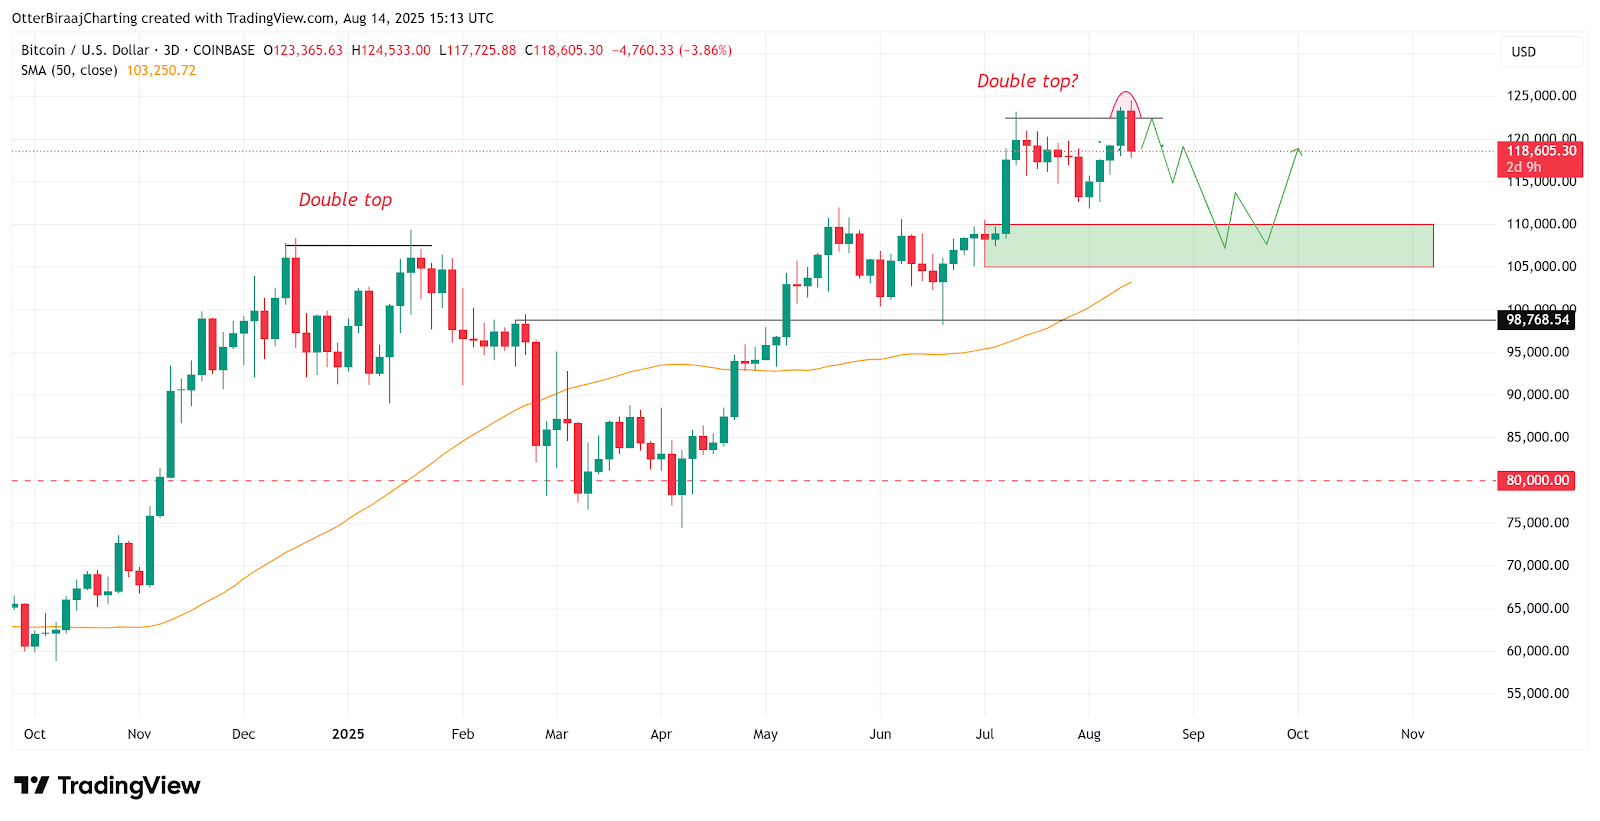
EthereumBitcoin 3-day chart. Source: TradingView
Beneath the macro negatives, Bitcoin's own technical structure had long harbored dangers. When the price broke through $123,000 to hit a new all-time high, the Relative Strength Index (RSI) showed a bearish divergence, indicating a衰竭 of upward momentum. An even more severe signal came from the 3-day chart – Bitcoin clearly formed a double-top pattern, which had triggered a 35% plunge in January 2025.
Psychological Game at Critical Support Levels
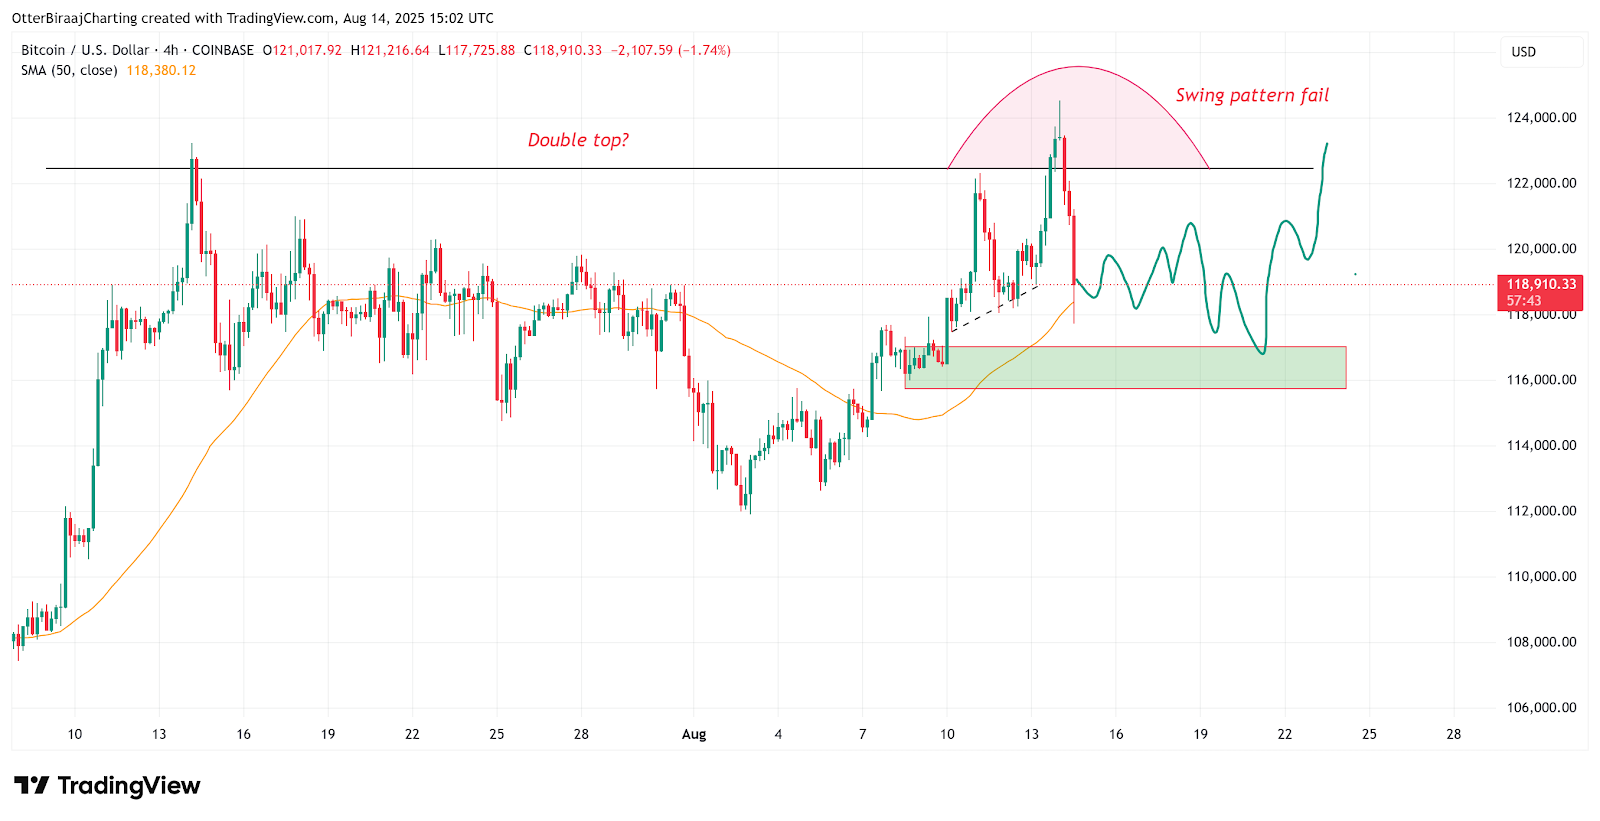
EthereumBitcoin 4-hour chart. Source: Cointelegraph
A life-and-death game unfolded at the $117,500 level in the market structure. Once this critical internal liquidity zone, closely watched by technical traders, was breached, it immediately triggered a chain reaction of programmatic sell orders. On the 4-hour chart, the emergence of a swing failure pattern预示 that the market will enter a phase of high-volatility oscillation. Currently, $112,000 has become a key dividing line between bulls and bears; if it is effectively broken, it may trigger a deep correction to the $105,000-110,000 range.
Death Spiral of Leveraged Liquidations
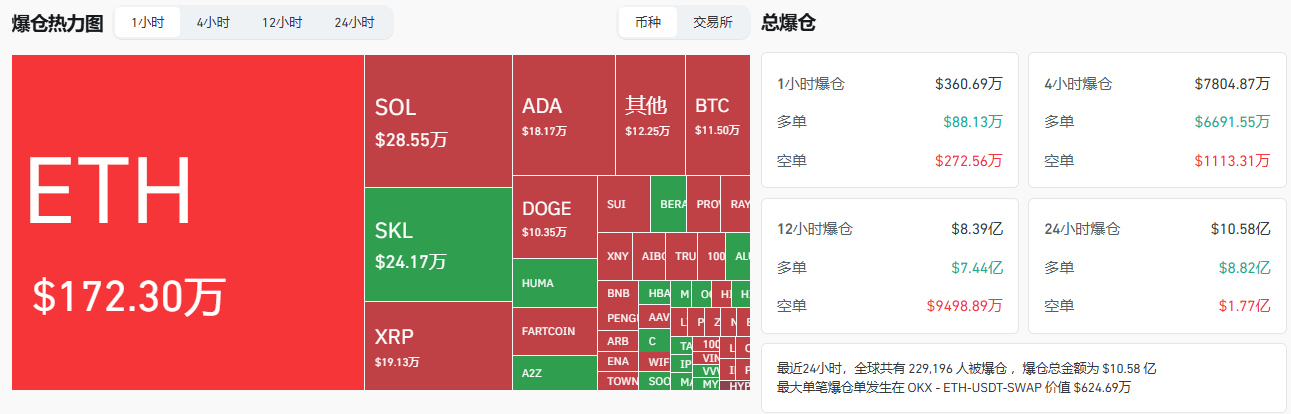
The most tragic part of the plunge was for leveraged long positions. When Bitcoin fell below $117,500, long positions worth up to $880 million were forced to close within 24 hours, forming a "long squeeze" stampede. This passive selling dominated by futures contracts further amplified the decline in the spot market, turning the correction into a mini-crash.
Paradox of Calm in the Derivatives Market
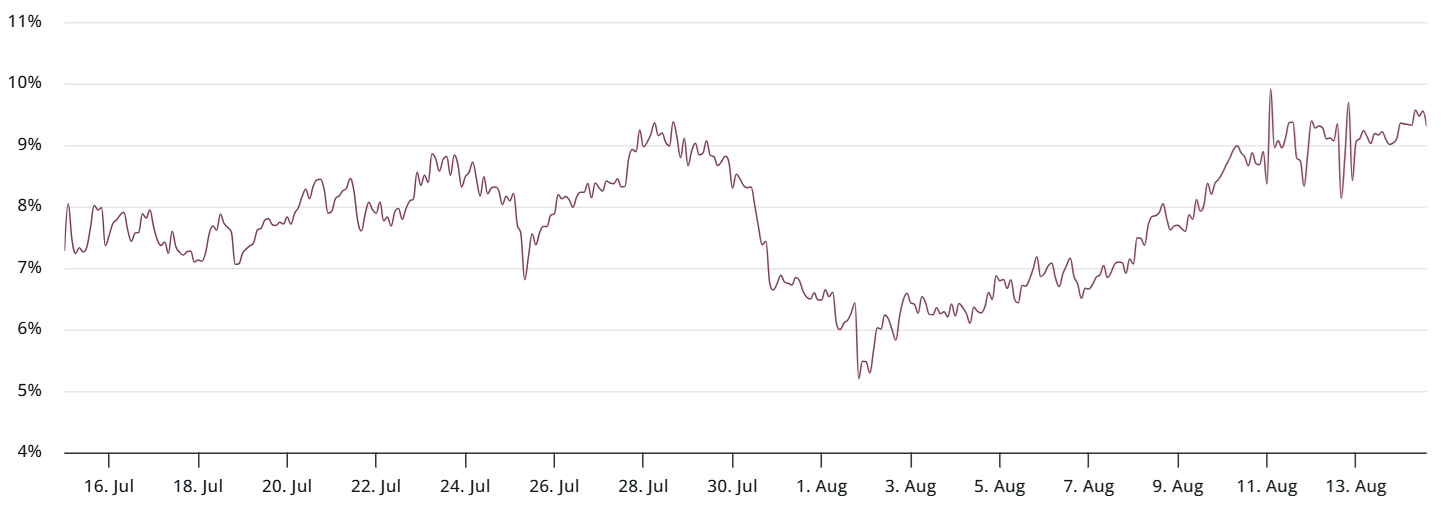
EthereumBTC 3-month futures annualized premium. Source: laevitas.ch
In sharp contrast to the panic in the spot and futures markets, professional derivatives traders showed remarkable calm. The annualized premium of Bitcoin futures stabilized at 9%, remaining in the neutral range of 5%-10%. This indicator proves that the all-time high was not driven by excessive leverage, and professional funds remain cautiously optimistic about the medium-term trend.
Confidence Code in the Options Market
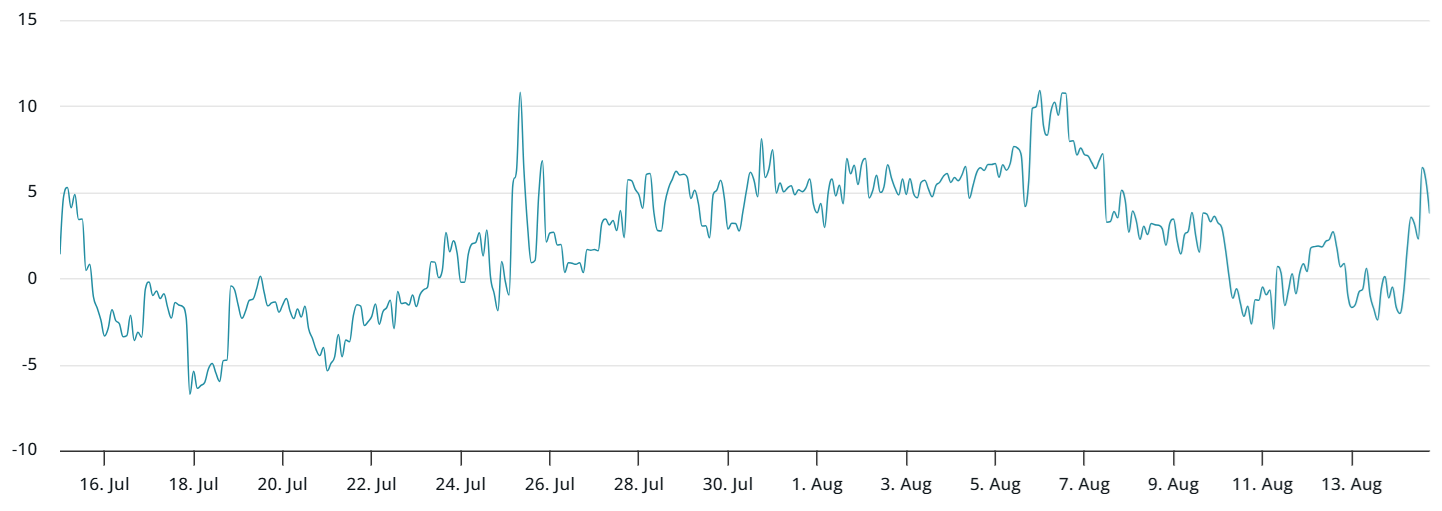
EthereumDeribit Bitcoin 30-day options Delta skew (put-call). Source: laevitas.ch
The real confidence indicator comes from the options market. Despite violent price fluctuations, Bitcoin's 30-day options Delta skew was only 3%, far below the 6% bearish threshold. This means institutional investors have not massively bought put options to hedge risks, and the core market sentiment remains neutral to strong. This emotional divergence between professional investors and retail investors reveals different participants' judgments on the nature of the plunge – professional traders view it as a healthy correction, while retail investors fall into panic selling.
Whales' Contrarian Operations
On-chain data reveals the movements of smart money. Whale addresses holding over 1,000 BTC accumulated 18,000 Bitcoins during the plunge, with costs concentrated in the $118,000-120,000 range. These "smart money" contrarian layouts have laid the groundwork for a market rebound.
In-depth Analysis of Structural Contradictions
Bitcoin's current pullback exposes deep contradictions in its market structure. When the Federal Reserve meeting minutes released signals of rate cuts and the S&P 500 index hit a new all-time high, Bitcoin weakened alone, revealing that its risky asset属性 still dominates. Despite being endowed with the "digital gold" aura, in actual market fluctuations, Bitcoin often behaves more as a substitute for tech stocks, highly correlated with traditional risky assets.
Lag Effect of Liquidity Transmission
There is a high correlation of 0.94 between global M2 money supply growth and Bitcoin's price, but liquidity transmission takes time. When the Federal Reserve scaled back quantitative tightening and market liquidity expectations improved, Bitcoin's sensitivity to policies has decreased, and it has instead responded more directly to changes in "real interest rates." This change in the monetary transmission mechanism makes Bitcoin more vulnerable to short-term emotional shocks during policy gaps.
Hedging Demand in Emerging Markets
A notable regional change is in the Latin American market. Trump's tariff policies triggered capital outflows from emerging markets such as Brazil and Mexico, where Bitcoin trading volume surged by 40%. When local fiat currencies face depreciation pressure, Bitcoin's attribute as an "exchange evasion tool" becomes prominent, and this structural demand provides invisible support for prices.
This flash crash exposed Bitcoin's vulnerability as an emerging asset – when reversed inflation data, disappointed policy expectations, and deteriorating technicals form a triple resonance, even stable derivatives indicators can hardly resist the spread of panic. However, whales are quietly acting at this moment, accumulating chips at costs of $105,000 to $108,000, laying the seeds for the next round of market trends.
Market attention is now focused on the critical support level of $112,000, which is not only a dividing line between bulls and bears but will also test whether Bitcoin can maintain the narrative logic of "digital gold." As the Federal Reserve's September rate cut window approaches and regulatory frameworks such as the U.S. "GENIUS Act" are implemented, this plunge triggered by the inflation ghost may eventually become a cruel coming-of-age ceremony for Bitcoin to become a mature financial asset.
Disclaimer: The views in this article only represent the author's personal opinions and do not constitute investment advice for this platform. This platform does not guarantee the accuracy, completeness, originality, or timeliness of the article's information, nor does it assume any responsibility for any losses arising from the use or reliance on the article's information.
Contact: Sarah
Phone: +1 6269975768
Tel: +1 6269975768
Email: xttrader777@gmail.com
Add: 250 Consumers Rd, Toronto, ON M2J 4V6, Canada


 +1 6269975768
 微信
微信 Teams
Teams